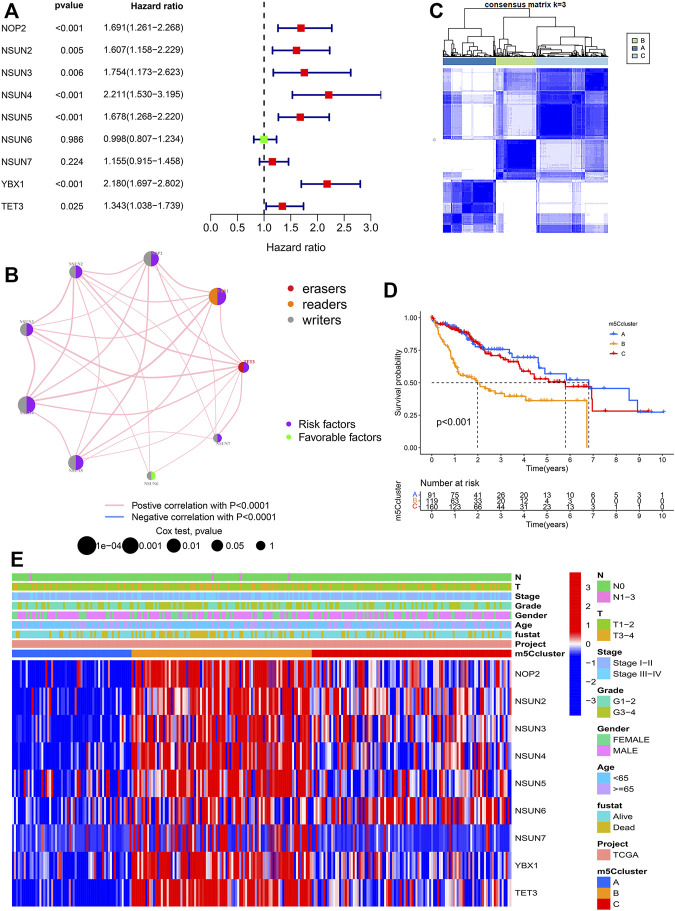
FIGURE 3.
Molecular characteristics of m5Cclusters. (A) Forest plot of univariate Cox regression analysis results; (B) Interaction of m5C regulators in HCC; (C) Consensus clustering matrix for k = 3; (D) Survival analysis of patients in distinct m5Cclusters; (E) Heatmap depicting the expression levels of m5C regulators in distinct m5Cclusters.

