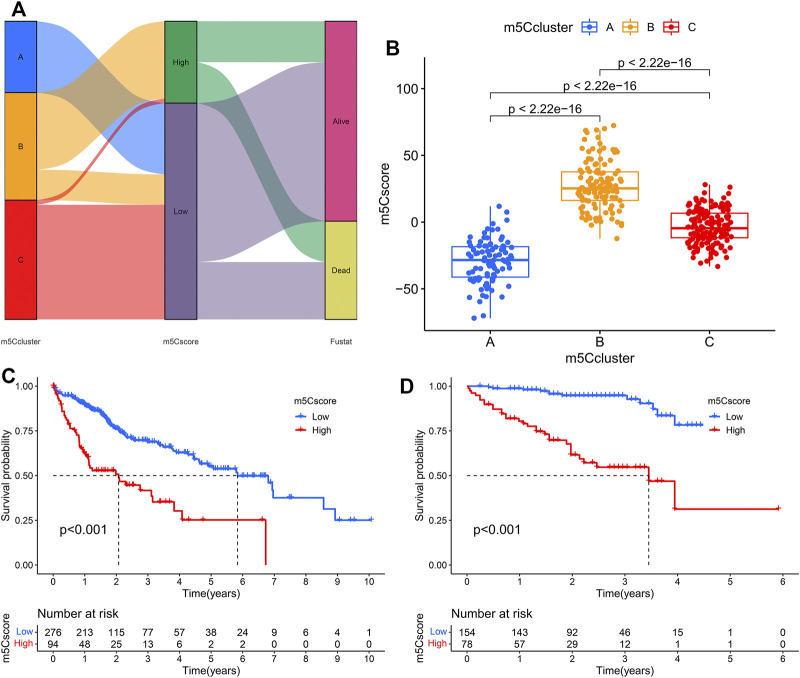
FIGURE 6.
Construction of the m5Cscore model. (A) Alluvial diagram showing the changes in m5Cclusters and m5Cscore; (B) Differences in m5Cscore among the three m5Cclusters; (C) KM analysis of patients in the high- and low-m5Cscore groups (TCGA cohort); (D) KM analysis of patients in the high- and low-m5Cscore groups (ICGC cohort).

