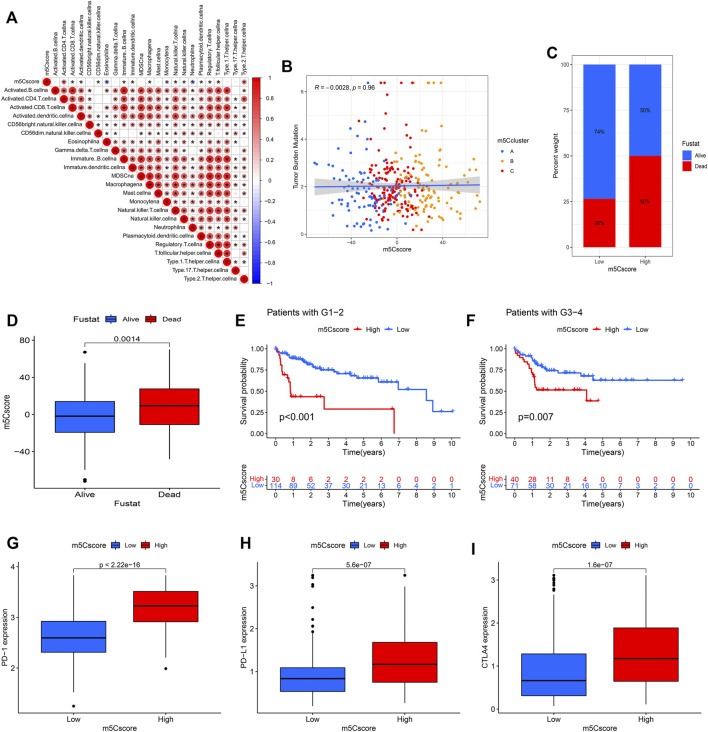
FIGURE 8.
Correlation analysis between the m5Cscore and some related biological pathways. (A) Immunocorrelation analysis; (B) Tumor mutation burden (TMB) correlation analysis; (C,D) Clinical correlation analysis; (E,F) Model validation in patients with different tumor grades; (G) PD-1 expression in distinct m5Cscore groups; (H) PD-L1 expression in distinct m5Cscore groups; (I) CTLA-4 expression in distinct m5Cscore groups.

