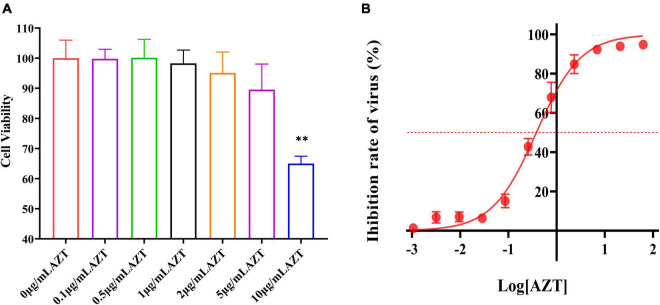
FIGURE 2.
Antiviral effect and cell viability of AZT at different concentrations. (A) Cell viability of DF-1 cells after AZT treatment at 0.1, 0.5, 1, 2, 5, and 10 μg/ml for 48 h by CCK-8 assay. The experiment was repeated three times. The error bars represent the SD. **P < 0.01 and ns represents not statistically significant. (B) Dose-response curve of AZT reveals the dose relationship between AZT and ALV-J. The x-axis represents the log of the concentration of AZT (μg/ml), and the y-axis represents the inhibition rate of virus (%), which was calculated according to Equation 2 and represents the proportion of virus titer reduction under drugs. The red dotted line indicates the position of 50% inhibition rate. The experiment was repeated eight times. The error bars represent the SD.

