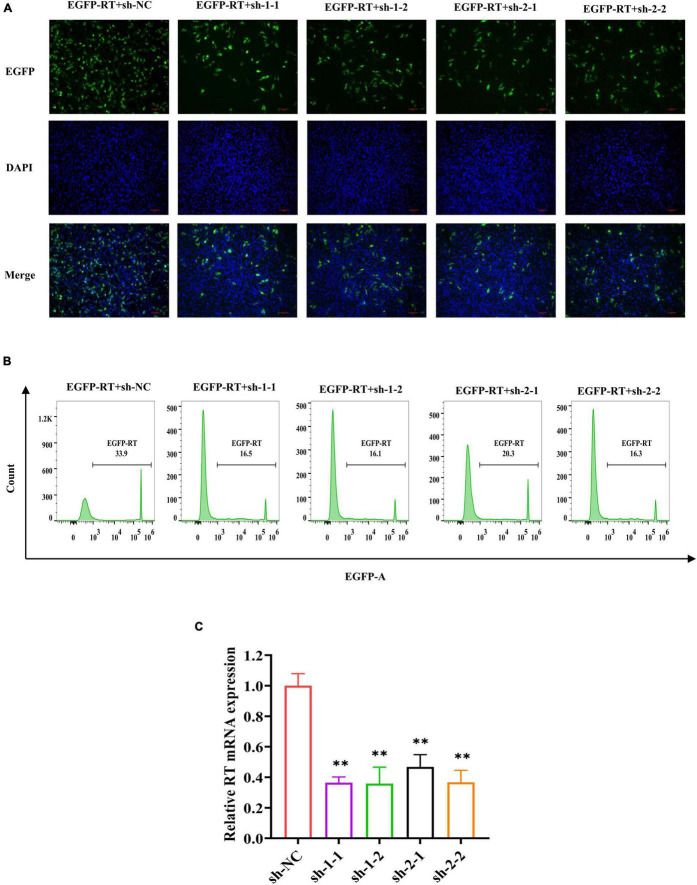
FIGURE 3.
Specific shRNA inhibits RT RNA transcript levels and RT-EGFP fusion protein expression. (A) EGFP fluorescence in DF-1 cells co-transfected with RT-EGFP fusion protein expression plasmid and shRNA expression plasmid were observed (magnification, ×200) at 48 h post-transfection. (B) The percentage of EGFP-positive cells was determined by a flow cytometer. The x-axis represents the fluorescence intensity of EGFP, and the y-axis represents the EGFP-positive cell count. The criterion of positive cells was that the fluorescence intensity of DF-1 cells was higher than 103. (C) Quantitative analysis of relative RT mRNA expression in DF-1 cells. The RNA transcript levels were determined by real-time PCR and normalized to β-actin. The experiment was repeated three times. The error bars represent the SD. **P < 0.01 and ns represents not statistically significant.

