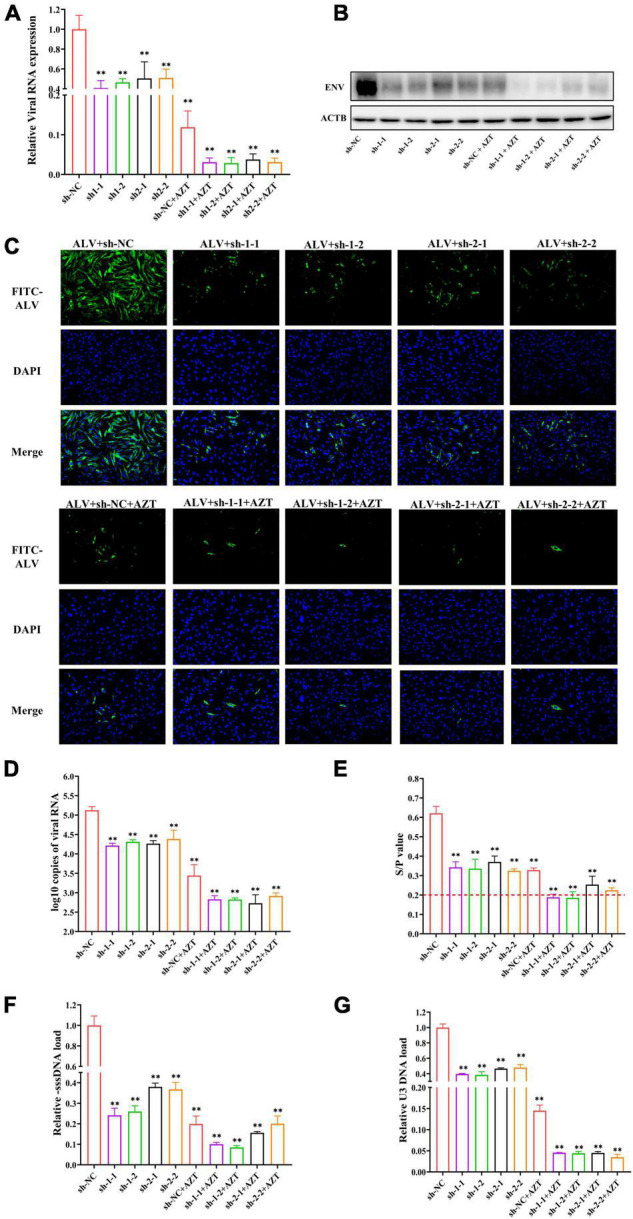
FIGURE 5.

Additive antiviral activity of shRNA and AZT. (A) Quantitative analysis of relative ALV RNA expression in DF-1 cells. The viral RNA levels were determined by real-time PCR and normalized to β-actin. (B) Western blot analysis of ALV-J ENV and β-actin in DF-1 cells. The expression levels of the envelope protein of ALV-J were normalized against β-actin. (C) Immunofluorescence detection of ALV-J in DF-1 cells. The expression of envelope protein of ALV-J was observed under a fluorescence microscope (magnification, ×200). Bright green indicates the presence of ALV-J–positive cell, and blue represents nuclei. (D) ALV-J loads in culture supernatant. The copies of ALV-J RNA were detected by real-time PCR and normalized to per 100 μl of culture supernatant. (E) p27 antigen levels of ALV-J were detected by ELISA. The red dotted line indicates the cut-off value (S/P = 0.2) of the positive criteria. (F,G) Quantitative analysis of the synthesis or transfer of the minus strand DNA of ALV-J in DF-1 cells. The pro-viral DNA levels were determined by real-time PCR and normalized to HMG-14b. **P < 0.01 and ns represents not statistically significant. All experiments were repeated three times. The error bars represent the SD.
