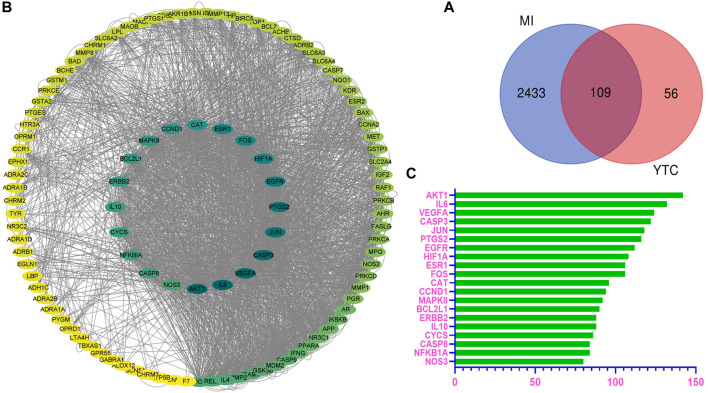
FIGURE 1.
Overlapped targets screen. (A) The protein-protein interaction (PPI) network of targets. The colors of the nodes are illustrated from green to yellow in descending order of degree values. (B) Overlap targets of YTC and MI. The blue circles represent MI targets and the red circles represent YTC targets. The overlapped area is the targets of YTC anti-MI. (C) The top 20 genes in the PPI network were selected based on the degree.

