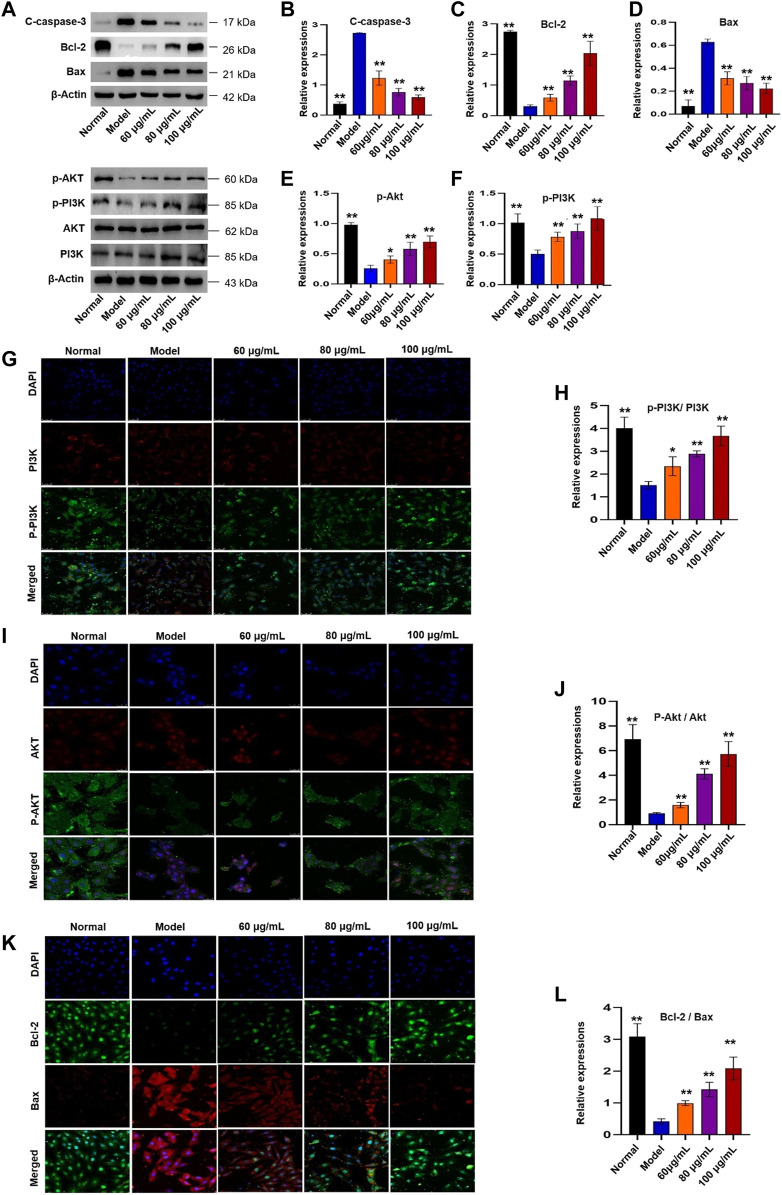
FIGURE 10.
Effects of YTC on PI3K/Akt signaling pathway in H2O2-induced H9c2 cells. (A) WB images of C-caspase-3, Bcl-2, Bax, p-Akt, p-PI3K, AKT and PI3K protein expression. (B) Analysis of C-caspase-3. (C) Analysis of Bcl-2. (D) Analysis of Bax. (E) Analysis of p-Akt. (F) Analysis of p-PI3K. (G) IF images of p-PI3K and PI3K. (H) Analysis of the p-PI3K/PI3K ratio. (I) IF images of p-Akt and Akt. (J) Analysis of the p-Akt/Akt ratio. (K) IF images of Bcl-2 and Bax. (L) Analysis of the Bcl-2/Bax ratio. Data were expressed as mean ± SD (n = 3), **p < 0.05 and **p < 0:01 vs model.

