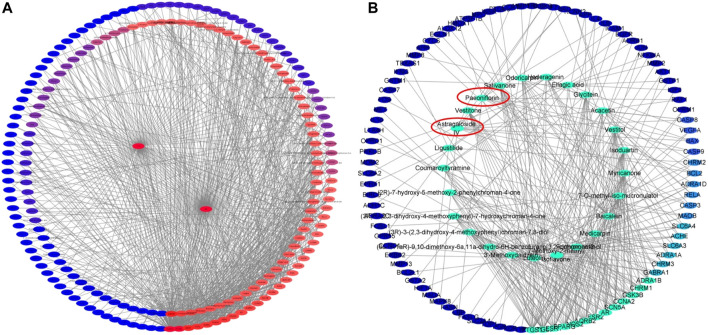
FIGURE 4.
Network analysis of potential active compounds and targets. (A)The drug, active compounds, disease and targets were input into Cytoscape to construct the DMTD diagram, and the colors of the nodes are illustrated from red to blue in descending order of degree values. (B) The top 25 components and their related targets in the DMTD network were selected based on the degree, and the colors of the nodes are illustrated from green to blue in descending order of degree values.

