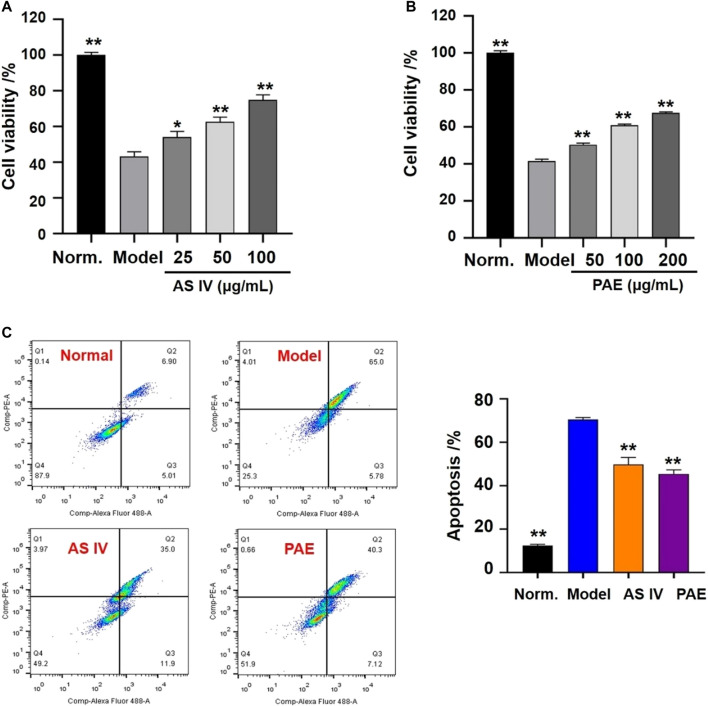
FIGURE 8.
Effects of the main active components (AS IV and PAE) on cell viability and apoptosis in H2O2-stimulated H9c2 cells. (A) Effects of AS IV on cell viability of H2O2-stimulated H9c2 cells under different concentration (25, 50 and 100 μM). (B) Effects of PAE on cell viability of H2O2-stimulated H9c2 cells under different concentration (50, 100 and 200 μM). (C) Apoptotic assay by flow cytometry. The values were represented as the mean ± SD (n = 3). *p < 0.05, **p < 0.01 vs model group.

