
Fig. 8.
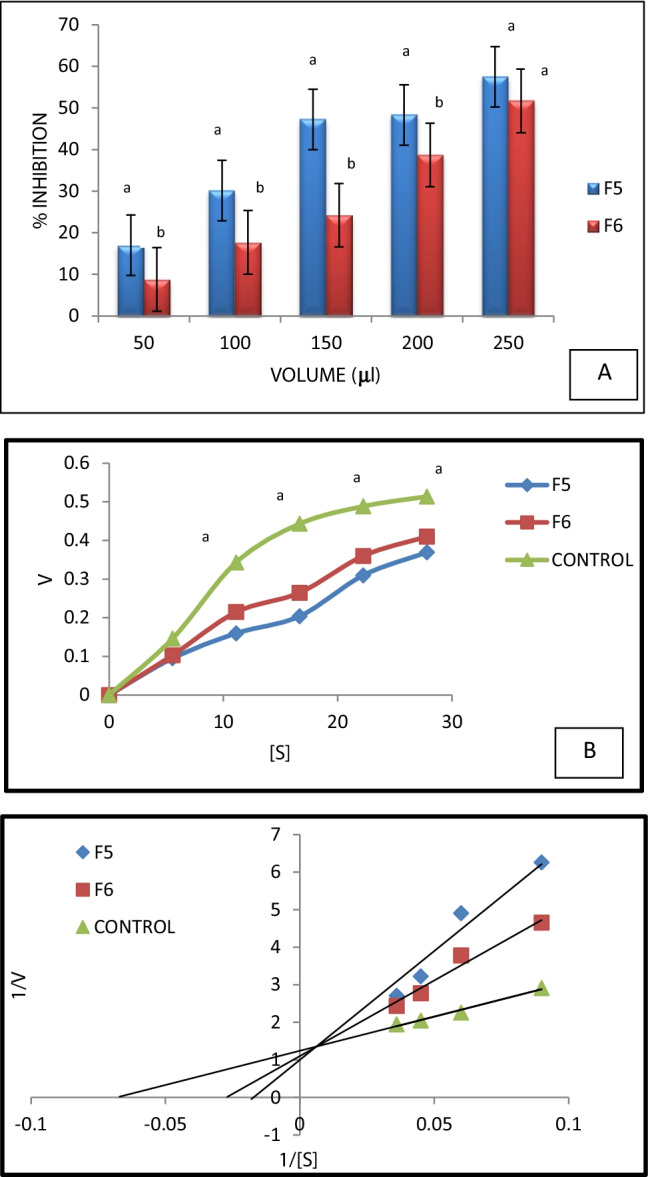
Anti-diabetic assay for LGO nano-emulsions (F 5 and F6), Lineweaver–Burk and Michaelis–Menten plot for F5 and F6 LGO nano-emulsions. Different letters in “A” panel indicates significant difference among F5 and F6 at P ≤ 0.05. Different letters in “B” panel indicates significant difference of F5 and F6 vs control at P ≤ 0.05