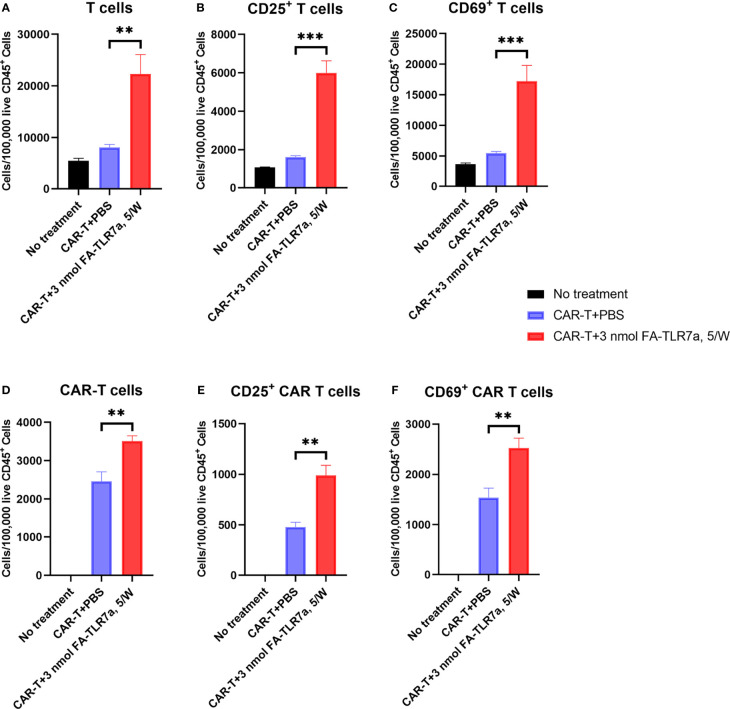
Figure 6.
Impact of CAR T cell therapy in the presence and absence of FA-TLR7-1A on the number and activation states of tumor-infiltrating T cells and CAR T cells. (A–C) The number of total T cells, CD25+ T cells, and CD69+ T cells per 100,000 live CD45+ cells in the tumors following the indicated treatments. (D–F) The number of total anti-CD19 CAR T cells, CD25+ anti-CD19 CAR T cells, and CD69+ anti-CD19 CAR T cells per 100,000 live CD45+ cells in the tumors following the indicated treatments. This study was performed three times with similar results each time. The number of mice/group is the same as reported in the legend to Figure 3 , except in the CAR-T + 3 nmol FA-TLR7-1A, 5/W group only 5 of 9 tumors could be analyzed because 4 of 9 mice experienced complete cures. Mean ± SEM. Statistical significance was determined using an unpaired two‐tailed t‐test (**P < 0.01, ***P < 0.001).

