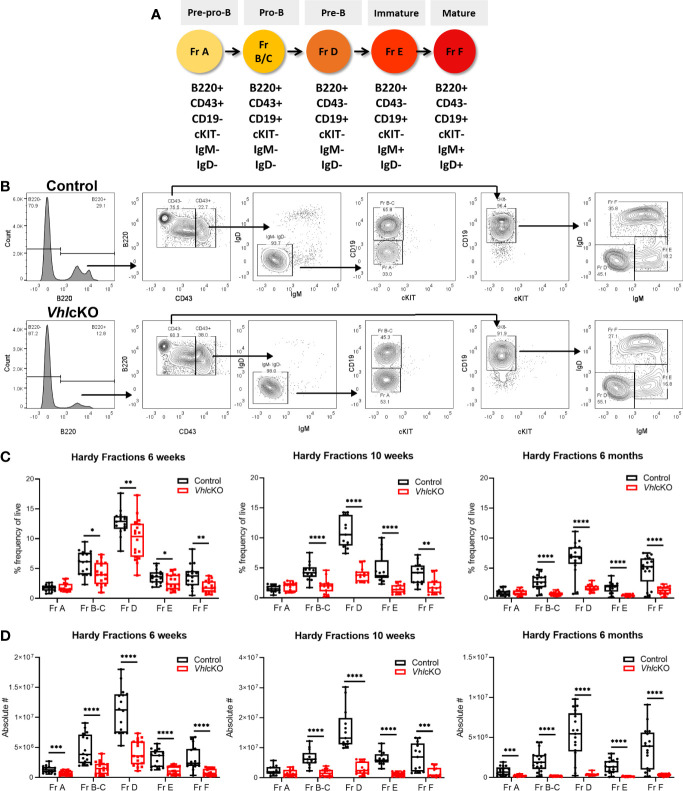
Figure 3.
Dysregulated B cell development in VhlcKO mice bone marrow. (A) Antigen markers used to identify and distinguish B cell development stages by flow cytometry. (B) Representative FACS plot of B cell development in the BM control (top) and VhlcKO (bottom); (C) B cell frequency in 6-week-old (left), 10-week-old (middle), and 6-month-old (right) mice; (D) absolute cell numbers in 6-week-old (left), 10-week-old (middle), and 6-month-old (right). p<0.05*, p<0.01**, p<0.001***, p<0.0001**** two-tailed Student’s t-test.

