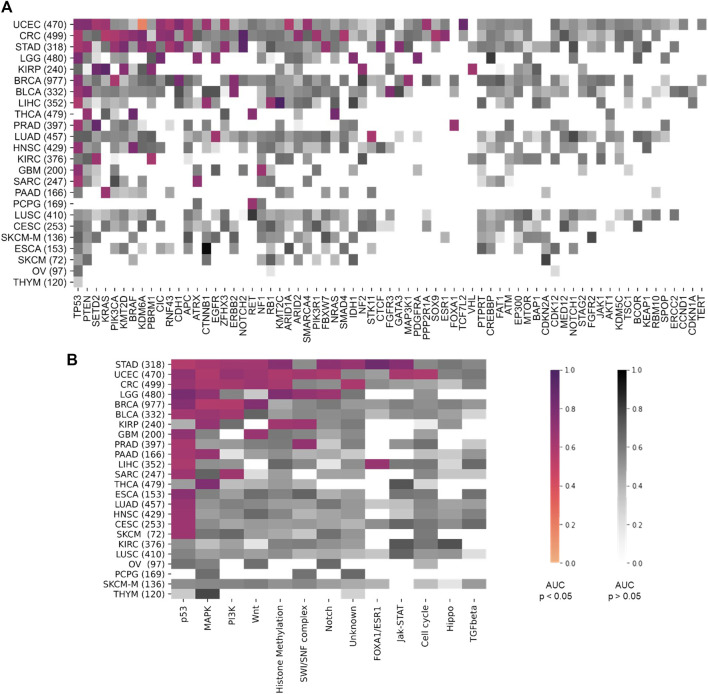
FIGURE 2.
Heatmap comparing the area under the receiver operating curve (AUROC) between the different tumor types. On the y-axis all tumor types are listed and sorted by tumor with most significant results from top to bottom. Number of patients indicated in brackets behind. Pathways are ordered on the x-axis from most (left) to least (right) significant results. AUROC values for (A) the twelve pathway analysis and (B) for the 69 gene analysis. Coloured values stand for significant detected (p > 0.05) pathways and grey for not significantly (p > 0.05). TCGA tumor type abbreviations are used (https://gdc.cancer.gov/resources-tcga-users/tcga-code-tables/tcga-study-abbreviations).

