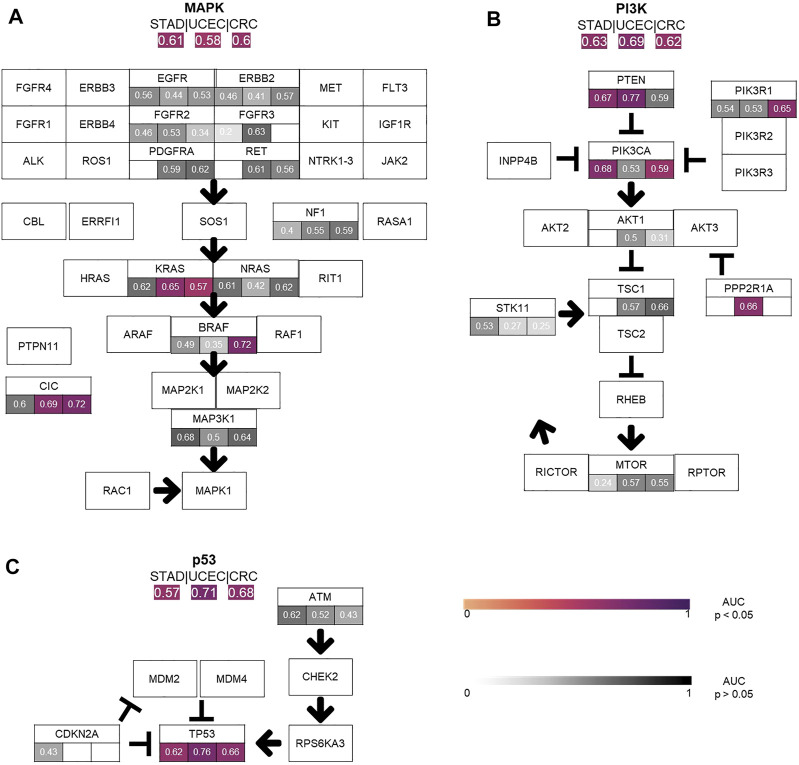
FIGURE 3.
Comparison of the performance of the single gene area under the receiver operating curve (AUROC) vs. pathway AUROC. The top three pathways (A) MAPK, (B) PI3K, (C) TP53 AUROC results for the three top tumor cohorts (STAD, CRC, UCEC) are illustrated. AUROC values are compared between single gene vs. whole pathway. Coloured values stand for significantly detected pathways and grey for not significantly detected (p > 0.05).

