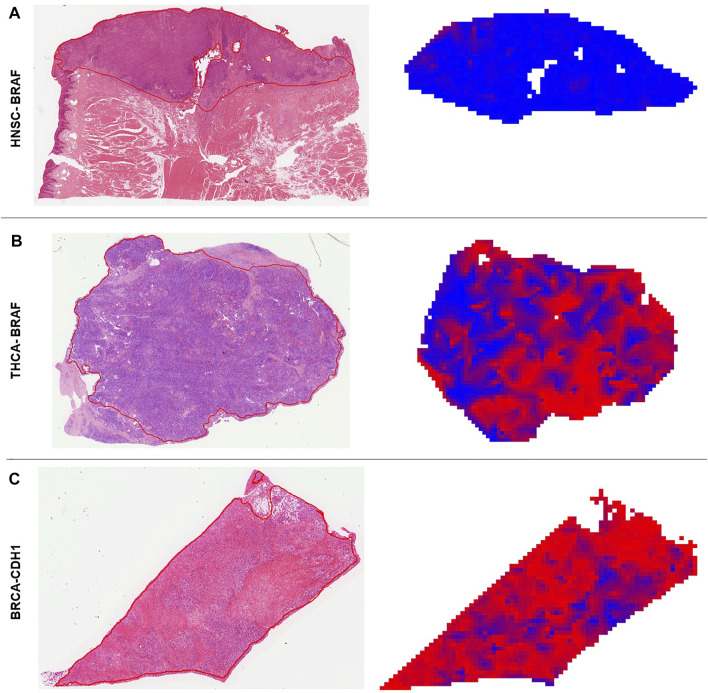
FIGURE 5.
Deep learning predicted heatmaps. Visualization of manually annotated histological slides hematoxylin & eosin (H&E) with corresponding prediction maps for altered genes. Blue areas are wild type (WT) predicted regions and red areas are identified as mutated (MUT) parts by the neural network. (A) H&E slide of a BRAF WT patient (ID: TCGA-CQ-5333) from the head and neck squamous cell carcinoma (HNSC) cohort. The homogenous blue heatmap is consistent with the wild type status of the patient. (B) H&E slide of a BRAF mutated patient (ID: TCGA-EL-A3H7) from the thyroid carcinoma (THCA) cohort. The heatmap is more than 50% red, which means the patient was correctly classified as MUT. Intermingled blue areas in tumor regions reflect stroma and artifacts that disturb these areas. (C) H&E slide of a CDH1 mutated patient (ID: TCGA-PE-A5DD) of the breast invasive carcinoma (BRCA) cohort. The prediction heatmap shows that stroma tissue is mostly predicted as WT (blue areas condensed connective tissue) and diffuse invasive-lobular cancer is mostly red.

