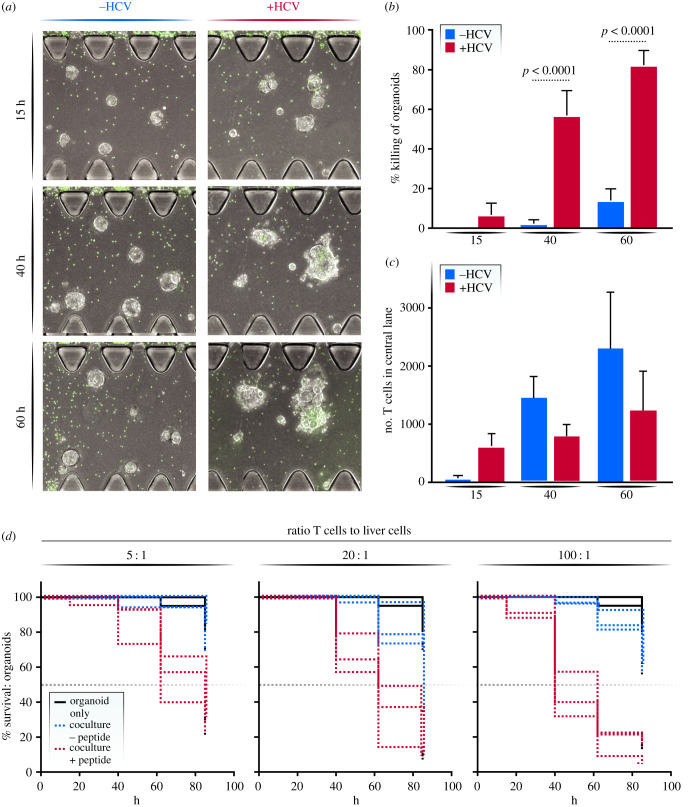
Figure 5.
T cell killing response. (a) Representative microscopy image of the effect of T cell–liver organoid interaction with and 0 without the HCV peptide presentation on liver organoids. (b) Quantification of viability of pulsed and unpulsed organoids at varying time points at a 100 : 1 effector to target ratio. (c) Number of T cells in the central channel in pulsed and unpulsed conditions. (d) Survival curve of organoids in monoculture (black), coculture with T cell clones (blue) and coculture with T cell clones after peptide pulsing (red) in 100 : 1, 20 : 1 and 5 : 1 coculture ratio of T cells to liver cells. Each line represents one replicate.

