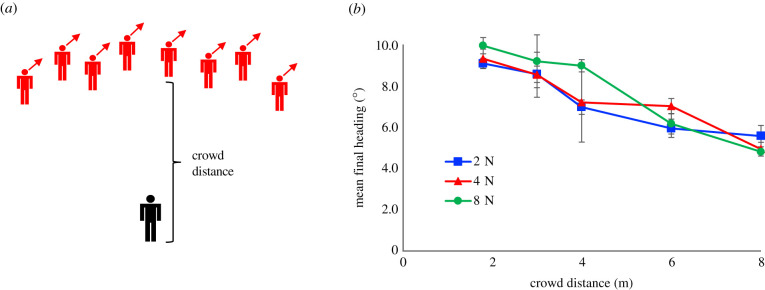
Figure 2.
Experiment 1: range of interaction, testing the decay with distance to fully visible neighbours. (a) Schematic of virtual crowd, illustrating a rightward heading perturbation. (b) Results: mean final heading as a function of crowd distance, for each crowd size (curves). Error bars represent ± s.e.m. (Online version in colour.)

