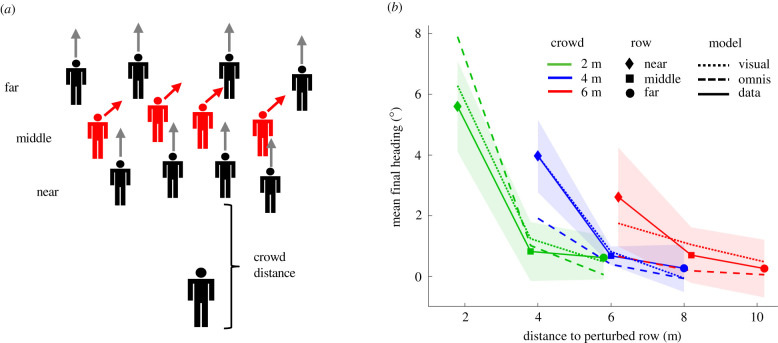
Figure 3.
Experiment 2: double-decay hypothesis. (a) Schematic of virtual crowd, illustrating a rightward heading perturbation of the middle row. (b) Results: mean final heading as a function of distance to the perturbed row (symbols), for each crowd distance (curves). Solid curves represent human data, dotted curves the visual model and dashed curves the omniscient model. Shaded regions represent 95% confidence intervals for the human data. (Models were not intended to reproduce gait oscillations, so their variable error is small and not represented.) (Online version in colour.)

