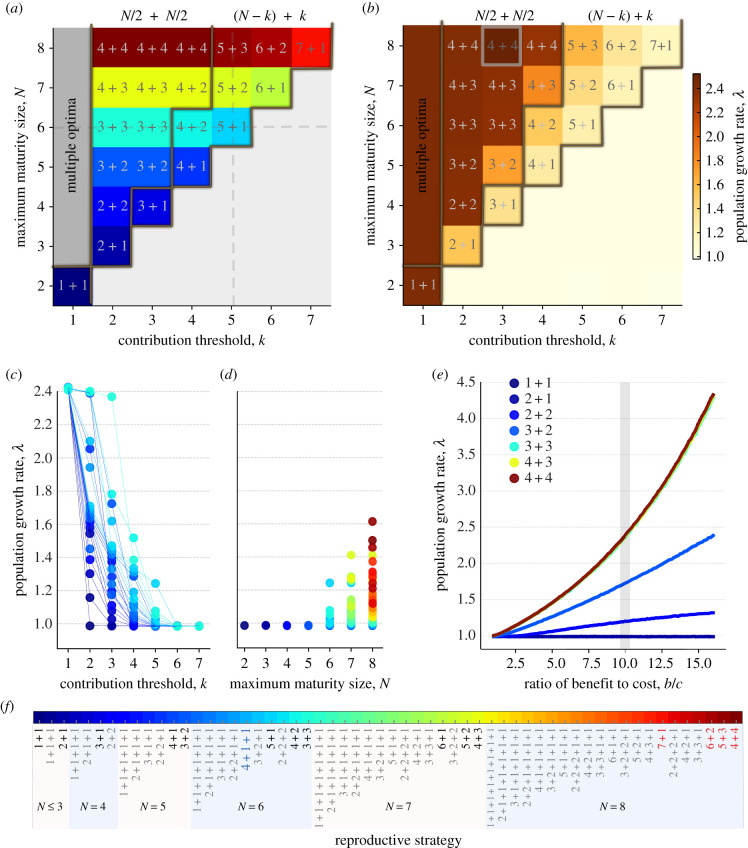
Figure 3.
Binary-splitting reproductive strategies are uniquely optimal for threshold effects with k > 1. (a) The optimal reproductive strategies across contribution threshold k (k < 8) and maturity size N (N ≤ 8). The grey lines (in a,b) are the boundaries between multiple optimal reproductive strategies (at k = 1), symmetric binary-splitting reproductive strategies, asymmetric binary-splitting reproductive strategies and those that never meet the threshold. The grey dashed lines indicate the parameter space where we investigated the population growth rate of each reproductive strategy in (c,d). (b) The population growth rates of the optimal reproductive strategies in (a). The highlighted parameter set with N = 8 and k = 3 is investigated in more detail in (e). (c) Population growth rates of different reproductive strategies with N ≤ 6 are shown across different contribution threshold k. (d) Population growth rates of different reproductive strategies under contribution threshold k = 5 are shown across different maturity size N ≤ 8. (e) The growth rates of populations with symmetric binary-splitting reproductive strategy are shown across to varying ratios of benefit to cost. (f ) The reproductive strategies that have been investigated for k ≤ 7 and N ≤ 8. The optimal reproduction modes that appear in (a) are highlighted in black. The uniquely optimal reproductive strategies under the threshold effect for k = ≤7 and N ≤ 8 are highlighted in bold and red. Parameters for all panels: w = 0.1, b = 10, c = 1 and m = 0.01.

