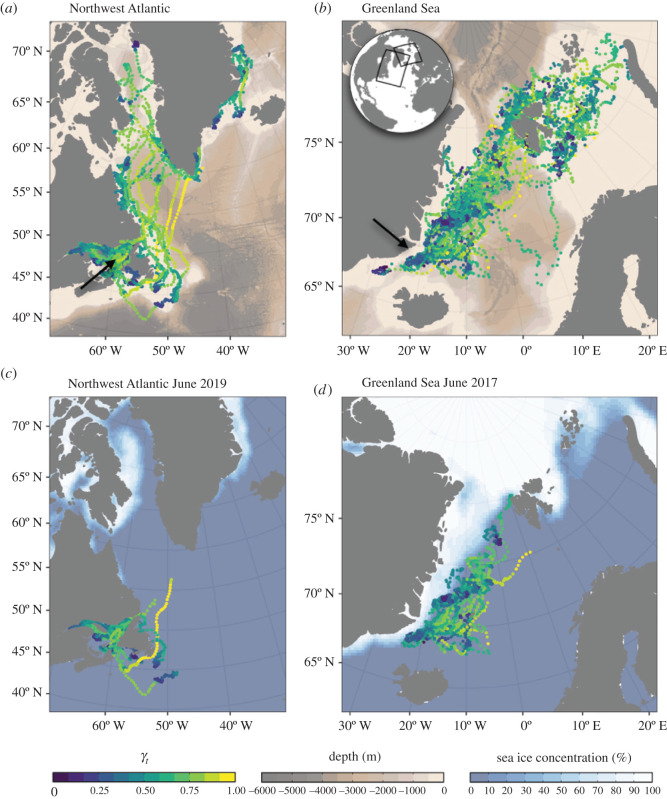
Figure 1.
Migratory paths for (a) Northwest Atlantic (n = 12) and (b) Greenland Sea (n = 26) juvenile harp seals tagged in 2019 and 2017, respectively, and movements of (c) Northwest Atlantic and (d) Greenland Sea seals up until June overlaid on average sea ice concentration for that month. Points represent state-space model filtered locations coloured by the move persistence estimate (γt). Arrows indicate tagging locations.

