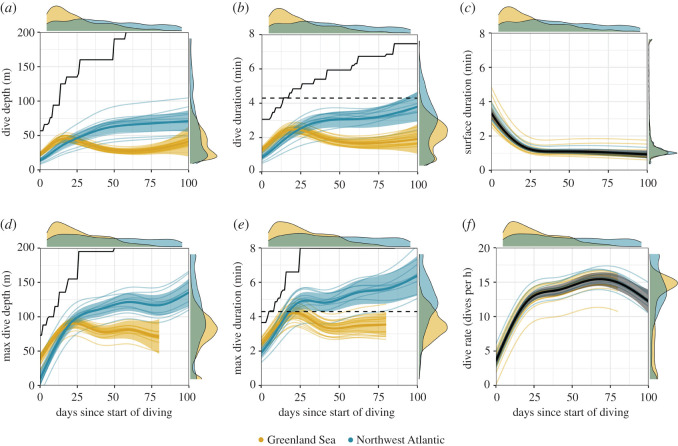
Figure 3.
Estimated temporal changes in (a) dive depth, (b) dive duration, (c) inter-dive surface duration, (d) maximum dive depth, (e) maximum dive duration and (f) dive rate for North Atlantic (blue) and Greenland Sea (yellow) harp seals fitted with SRDLs. (a–c) are based on individually transmitted dives, (d–f) are based on 6 h summarized dive data. Solid line represents mean response, shaded areas the 95% CI. Background lines represent model estimated individual-level response. For Greenland Sea animals, dive summary data in (d–f) was only transmitted for 80 days after individuals commenced diving. Dashed black lines in (b) and (e) represent estimated aerobic dive limit for young of the year [45]. Solid black lines in (a), (b), (d) and (e) represent the physiological maximum based on the cumulative 95th percentile of all records. Marginal density plots indicate spread of data.

