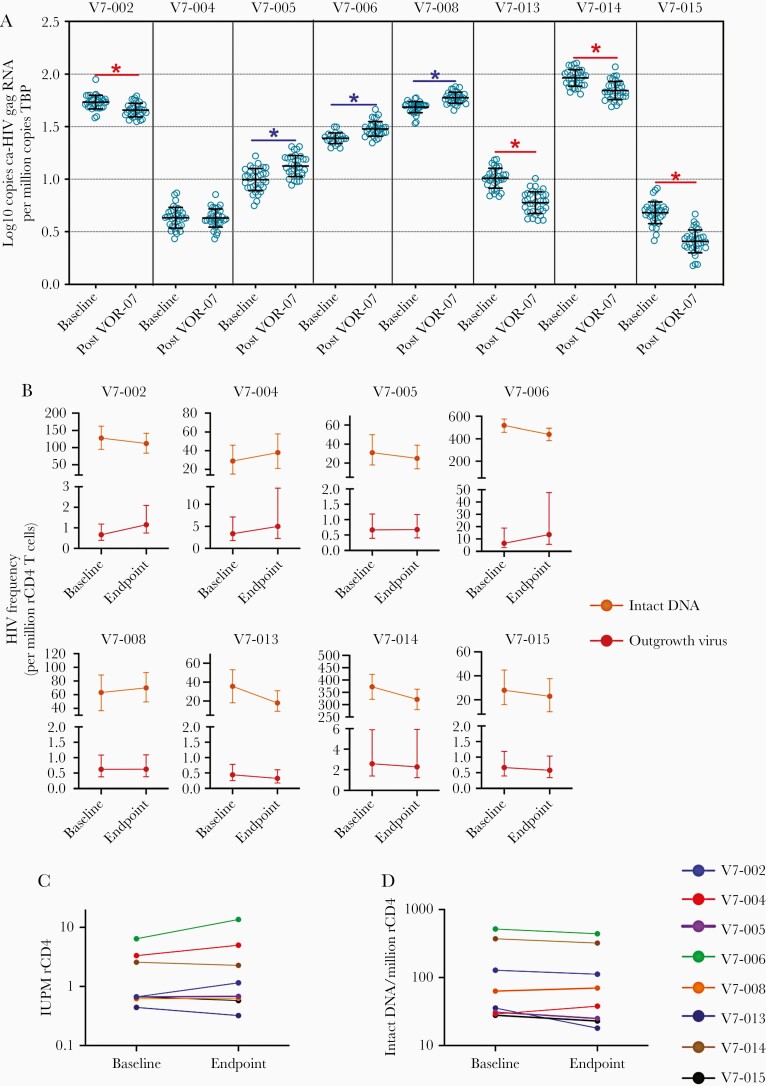
Figure 1.
Impact of VOR and VRC07-523LS on HIV reservoir measurements. A, Changes in resting CD4 cell-associated HIV-1 gag RNA from baseline to week 16 after 2 cycles of VOR/VRC07-523LS. Declines (red) and increases (blue) were significant P<.0001 by Wilcoxon 2-sample test. At each time point 24–36 replicates of 1 × 10⁶ rCD4+ T cells were evaluated. Mean and SD are shown. B, Linear scale frequency of replication-competent HIV in rCD4 T cells measured by quantitative viral outgrowth assay (red) and intact HIV DNA by IPDA (orange) before and after the study intervention. Dotted lines highlight the study period. Errors bars for QVOA represent the 95% CIs from the maximum likelihood method. Errors bars for IPDA measurements represent 95% CIs for the proviral frequency estimates using the total error from the QuantaSoft analysis software. C and D, Log scale changes in frequency of (C) replication-competent HIV by QVOA and (D) intact HIV DNA by IPDA. Abbreviations: CI, confidence interval; HIV, human immunodeficiency virus; IPDA, intact proviral DNA assay; QVOA, quantitative viral outgrowth assay; rCD4 T cell, resting CD4 T cell; VOR, vorinostat.

