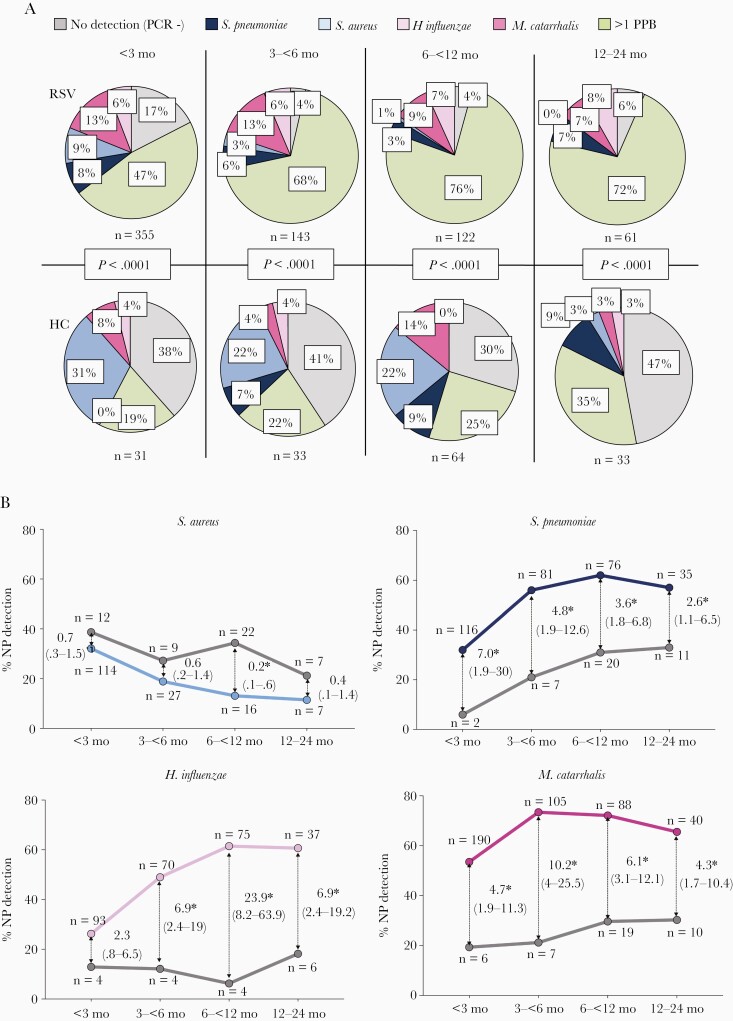
Figure 3.
Nasopharyngeal (NP) bacterial detection stratified by age in children with respiratory syncytial virus (RSV) infection in relation to healthy controls. A, Pie charts depicting the proportion of nasopharyngeal bacterial detected in RSV patients (upper panels) and healthy controls (HC; lower panels) stratified by age: no detection of the 4 bacteria (PCR−; gray), single detection of Streptococcus pneumoniae (dark blue), Staphylococcus aureus (light blue), Moraxella catarrhalis (dark pink), Haemophilus influenzae (light pink), and >1 potentially pathogenic bacteria (PPB; green). Comparisons by χ2 for each age group. B, Odds of S. aureus, S. pneumoniae, H. influenzae, and M. catarrhalis detection in RSV patients (colored lines) in relation to healthy controls (gray lines) according to age. Thin arrows indicate the odds ratio (95% confidence interval) for each age group comparison. Asterisks indicate the time points that are significantly different. The numbers of RSV patients and controls per bacteria and age group are depicted in each plot. Analyses by χ2 test for trends.

