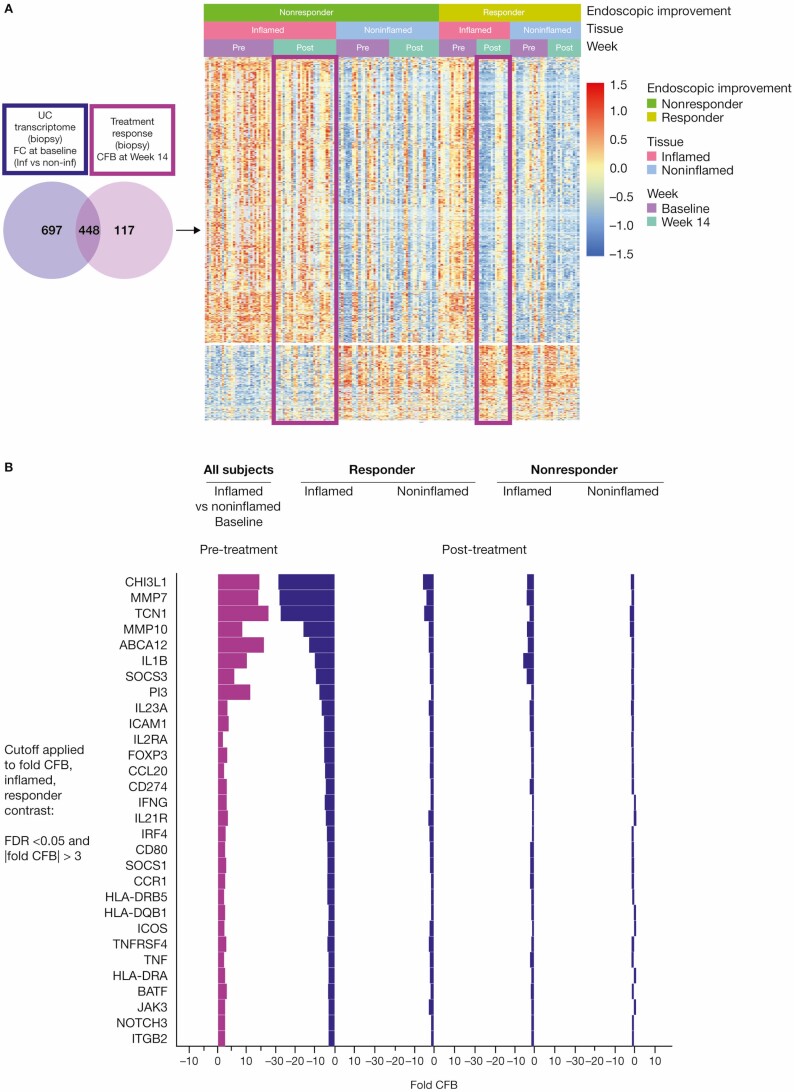
Figure 2.
Anti-TL1A transcriptomics demonstrates colonic molecular disease resolution. A, Left: the UC transcriptome shown in purple represents the FC of inflamed vs noninflamed biopsies at baseline; a total of 1115 genes were identified. The anti-TL1A transcriptome shows the genes that are modulated post-treatment (light purple) and represents the CFB at week 14 in the biopsy; a total of 565 genes were identified. In total, 448 disease-specific anti-TL1A treatment-modulated genes were identified. The genes represented in the Venn diagram met a significant cutoff FDR < 0.05 and |FC| >2. Right: a heatmap of differential genes identified in the Venn diagram is presented in clusters by endoscopic improvement responders and nonresponders in inflamed and noninflamed biopsies pre- and post-treatment. B, Shows that mechanistic and cellular pathways impacting inflammation and fibrosis genes were associated with anti-TL1A treatment in tissue. Significant genes in mechanistic and cellular pathways that were modulated in endoscopic improvement inflamed biopsies post-treatment with anti-TL1A were identified by CFB with FDR <0.05 and |FC| >3. Abbreviations: CFB, change from baseline; FC, fold change; FDR, false discovery rate; IL, interleukin; TL1A, tumor necrosis factor-like ligand 1A; UC, ulcerative colitis.

