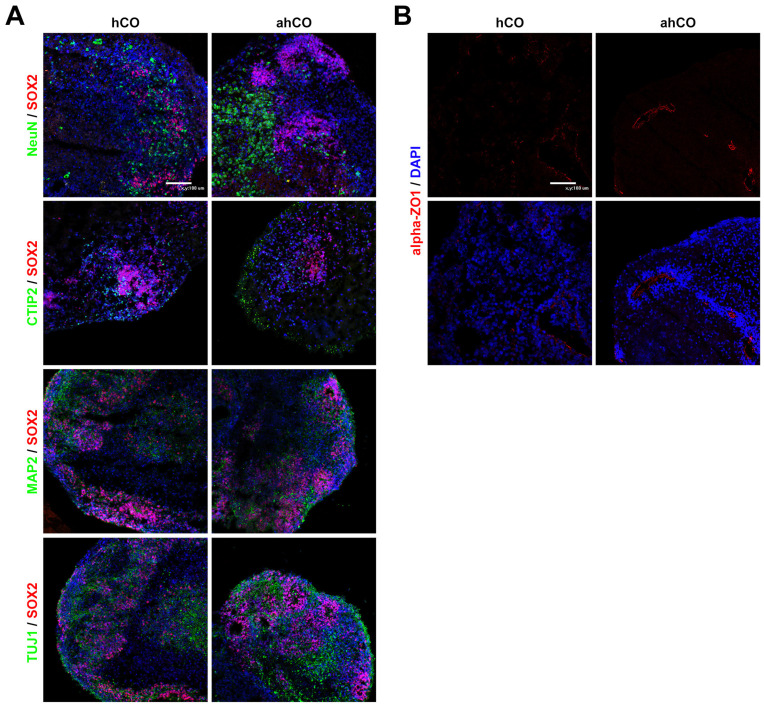
Fig. 3.
Neuronal characterization of cerebral organoids. (A) Representative images of each organoid on day 43 stained with NeuN, CTIP2, TUJ1 and MAP2. Nuclei are stained with DAPI (Scale bar: 100 μm). (B) Immunostaining images of α-ZO1 in each group on day 60 (Scale bar: 100 μm). Student’s t-test, n=3, independent organoids from 2 different batches. *p<0.05; n.s. not significant.

