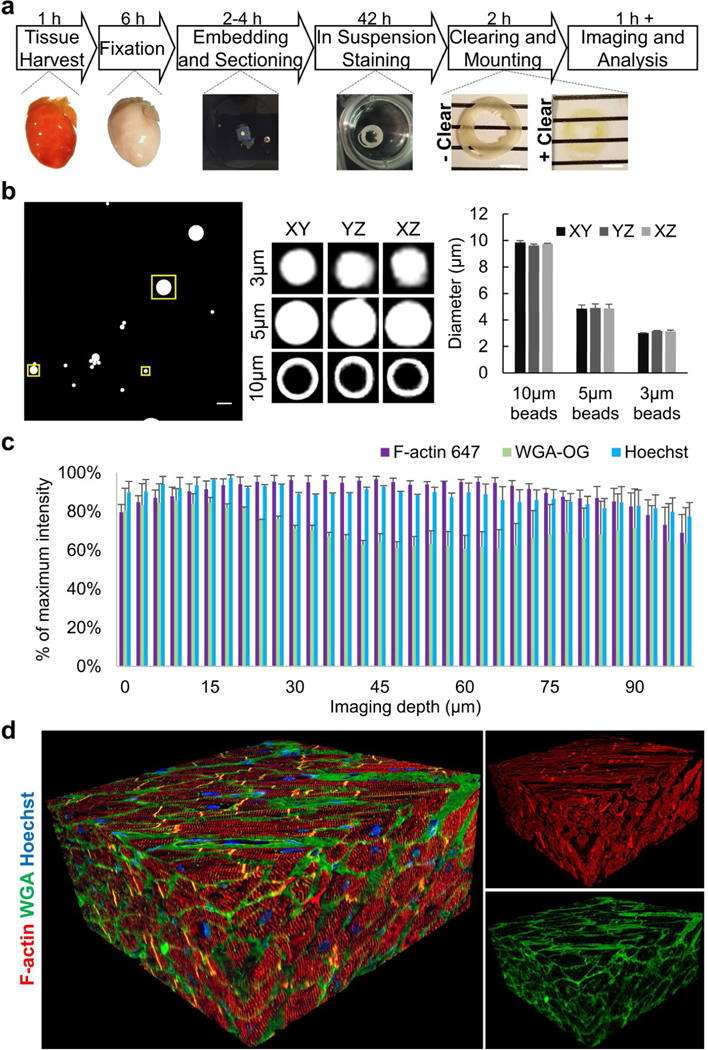
Figure 1: Overview of method and quality control.
(a) Overview of protocol showing major steps and timing from tissue harvesting to imaging. Scale bar=4 mm. (b) Quality control representative images of fluorescent microbeads of different sizes mounted in BABB with a #0 coverslip, as done with subsequent tissue samples. The large image is a maximum intensity image of the z-stack with the boxed regions being 3.75, 6.26, and 12.73 μm2 and enclosing 3, 5, or 10 μm beads, respectively. Note the 10 μm beads are only fluorescently labeled at the bead surface. The boxed regions were examined with orthogonal slices of the z-stack and the maximum diameter slice for each dimension are shown in representative images and quantified. (c) Quality control for signal intensity through 100 μm of cardiac tissue using Z-intensity profiling. The average signal intensity per z-slice confirmed uniform staining and clearing for various fluorescent stains. (d) Representative 3D reconstruction of adult normal human heart. F-actin (red), WGA (green), and Hoechst (blue) staining from 373 confocal images, z-step size=300 nm. Acquired with 60x oil NA=1.4 objective.

