Fig. 3.
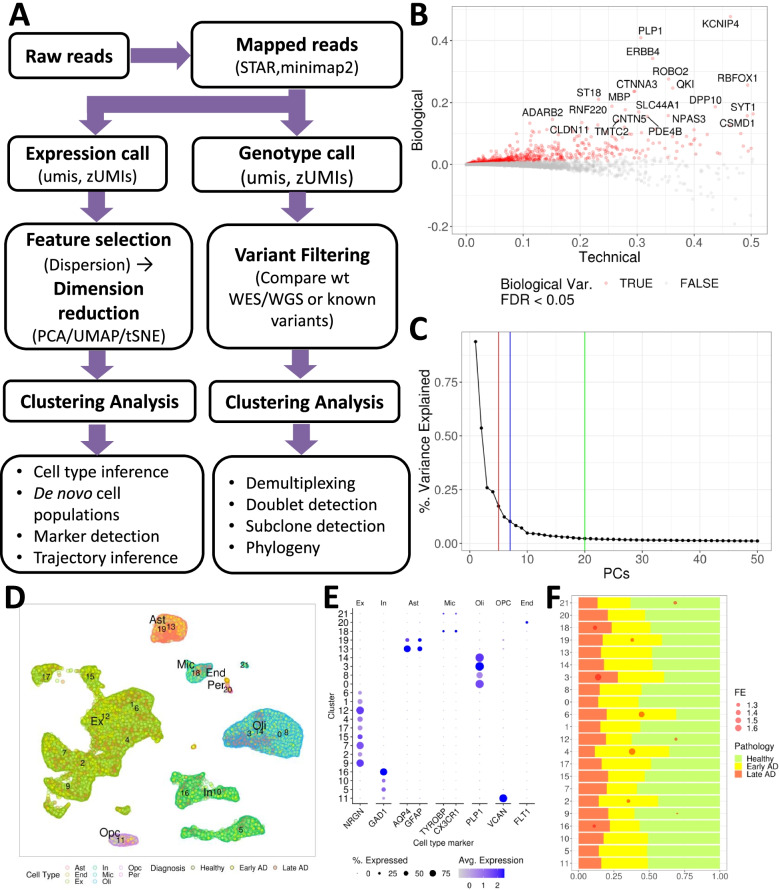
Recommended workflow of feature selection, dimension reduction, and clustering, and applications in AD. A Recommended workflow of dimension reduction and unsupervised clustering analysis of AD scRNA-seq data. Software tools are provided for each step. B Technical variance vs biological variance plot from the ROSMAP snRNA-seq data. The red dots depict genes with significantly greater biological variance than the technical variance (FDR < 0.05) and the top 20 most significant genes are labeled. C PC versus percentage of the variance explained. Vertical lines indicate recommended number of PCs from different workflows (red: PC denoising workflow from scran, blue: elbow point from Seurat, green: default number of PCs in Seurat). D UMAP plot of snRNA-seq from ROSMAP cohort. Clustering by PhenoGraph implemented in Seurat is marked by numeric labels. The cell types identified by marker gene expressions in (E) are highlighted as different border colors with relevant cell type name labels (Ast: astrocyte; End, endothelial; Ex: excitatory neurons; In: inhibitory neurons; Mic, microglia; Oli, oligodendrocytes; Opc: oligodendrocytes progenitor cells), and AD pathology (Healthy - green, early AD – yellow, late AD - red) are highlighted as different point colors. E dot plots of brain cell type markers showing their cluster-wise expressions. Clusters on the y-axis are ordered according to their proximity in the UMAP plot in (D). F Proportions of cells at different AD stages. FET is performed to evaluate whether the cells from each AD stage are enriched in each cell cluster. As significant enrichment is based on a cutoff of 0.05 for corrected FET p-value. In the plot, red dots represent the cases with fold enrichment (FE) > 1.3

