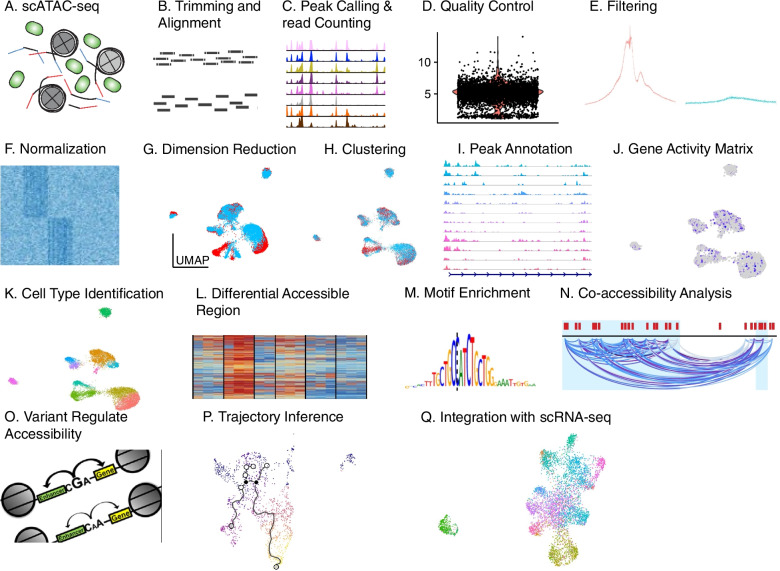
Fig. 7.
Overview of the procedures for analyzing scATAC-seq data. scATAC-seq raw data are collected from sequencing machines (A). Sequencing adaptors are trimmed and reads are then aligned to the reference genome (B). Peaks are called for each cell and merged into a set of unique features (peaks); reads are then counted for each feature in each cell to obtain a feature-by-cell matrix (C). Features and cells go through quality control (D) to remove low-quality features and cells (E). Filtered data are then normalized (F). Top variable features are extracted to perform linear and non-linear dimension reduction (G) that are further utilized for clustering analysis to identify cell clusters (H). Features (peaks) are annotated to gene (I) and reads are counted for each annotated gene in each cell to obtain a gene activity matrix (J). Cell-cluster-specific accessible chromatin regions and cell-cluster-specific activated genes are identified for each cell cluster to identify cell type (K). Genes with differential activity and differentially accessible chromatin regions are identified between conditions in each cell type (L). Transcription factor motifs are identified in each cell type (M). Co-accessibility analysis can be performed to infer cell-type-specific interactions between different genomic elements (N). Function of disease-associated genetic variant can be inferred by integrating them with scATAC-seq data (O). Trajectory analysis can be performed to infer cellular dynamics during developmental or disease progression (P). When available, scRNA-seq can be integrated with scATAC-seq data (Q) to infer cis-regulatory network

