
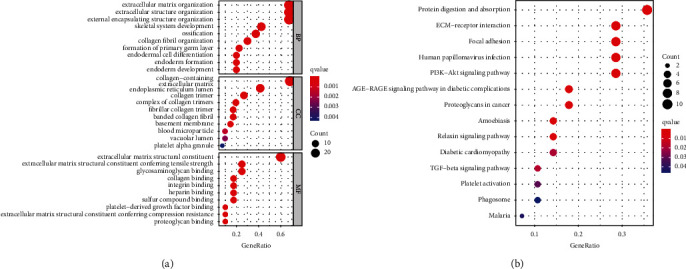
Figure 6.
GO analysis and KEGG pathway analysis of the differentially expressed genes between high SLC6A1 expression group and low SLC6A1 expression group from TCGA datasets. (a) GO enrichment analyses. (b) KEGG pathway enrichment analysis.
Official websites use .gov
A
.gov website belongs to an official
government organization in the United States.
Secure .gov websites use HTTPS
A lock (
) or https:// means you've safely
connected to the .gov website. Share sensitive
information only on official, secure websites.
GO analysis and KEGG pathway analysis of the differentially expressed genes between high SLC6A1 expression group and low SLC6A1 expression group from TCGA datasets. (a) GO enrichment analyses. (b) KEGG pathway enrichment analysis.