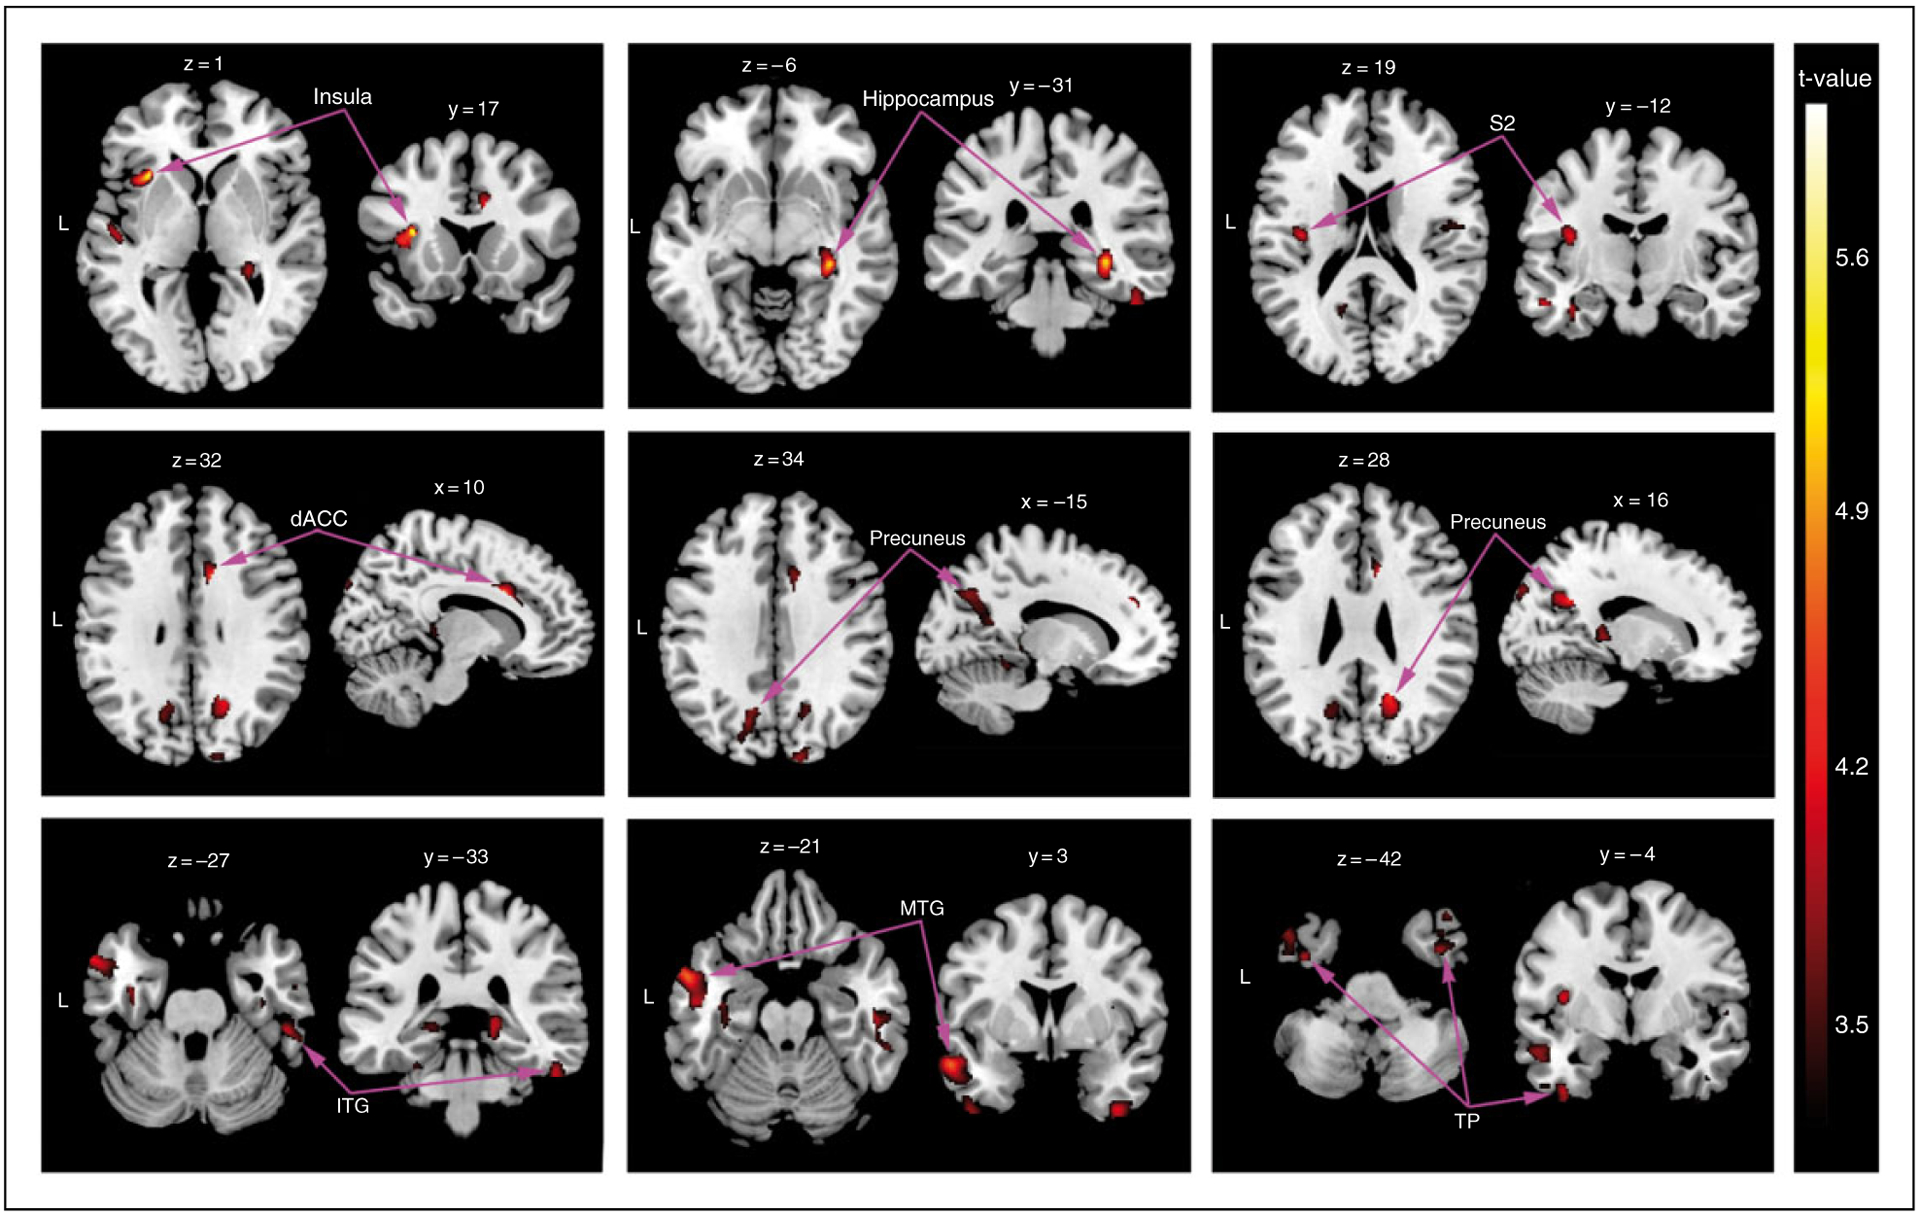
Figure 5.

VBM analysis of GMV. VBM analysis revealed significantly decreased GMV clusters in primary TN patients compared to control subjects. In particular, GMV atrophy was observed in the left insula, left S2, right hippocampus, right dACC, bilateral precuneus, and several portions of the temporal lobe (p < 0.05, FDR corrected). Images are shown on the MNI template in neurological convention (x, y, and z values refer to MNI coordinates) with the gradient color bar corresponding to t-values of the clusters. VBM: voxel-based morphometry; MNI: Montreal Neurological Institute; GMV: grey matter volume; S2: secondary somatosensory cortex; dACC: dorsal anterior cingulate cortex; FDR: false discovery rate.
