Figure 5.

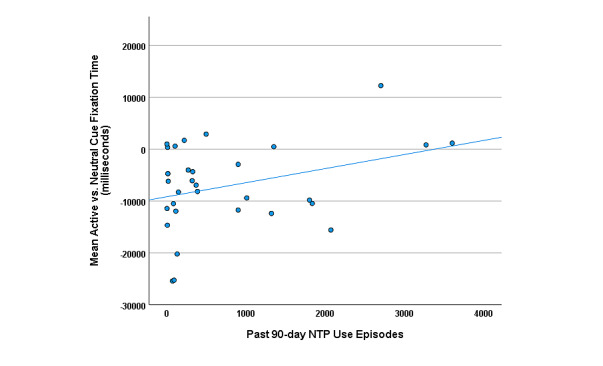
Scatter plot depicting the linear relationship between mean Active versus Neutral cue fixation time (in milliseconds) averaged across the 3 Active scenes and past 90-day nicotine and tobacco product (NTP) use episodes.

Scatter plot depicting the linear relationship between mean Active versus Neutral cue fixation time (in milliseconds) averaged across the 3 Active scenes and past 90-day nicotine and tobacco product (NTP) use episodes.