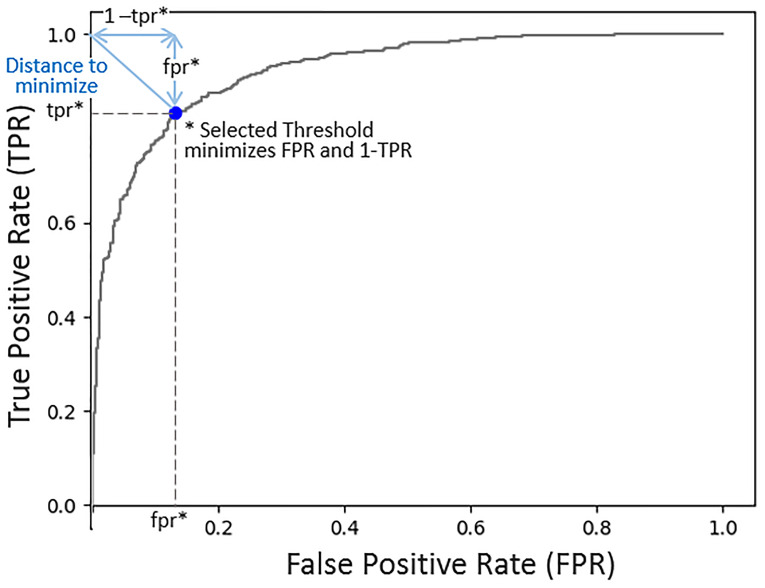
Figure 4.
Model probability threshold selection. The objective is to minimize the false positive rate (FPR) and maximize the true positive rate (TPR). This ROC plot (FPR, TPR), illustrates that by minimizing the distance from the point (0,1) to the curve, we are minimizing FPR2 + (1 - TPR)2, thus achieving our objective. The selected threshold corresponds to the FPR and TPR at which the line intersects with the curve minimizing the distance to the point (0,1).

