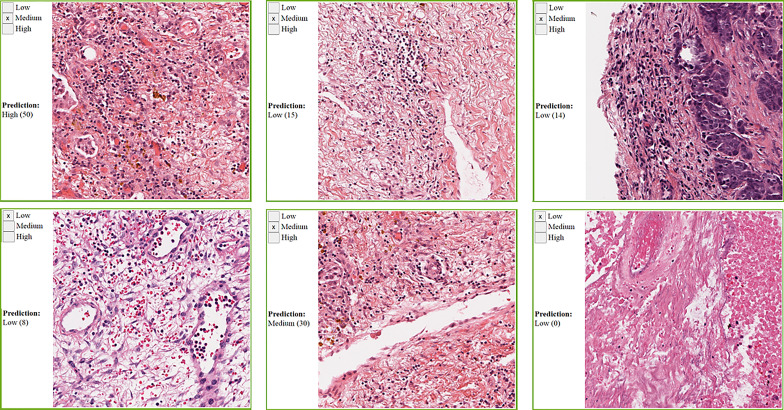
Figure 8.
Sample OV super-patches, showing the categorical label and the Inception model prediction. The model prediction is displayed as a category and a score between brackets. The models’ scoring is a value in the range 0 to 64. We roughly interpret it as: Low if 0 ≤core ≤ 21, Medium if 22 ≤core ≤ 42, and High otherwise. Top row: cases where the category approximated from the model scoring does not match the pathologists’ label. Bottom row: cases where the category approximated from the model scoring matches the pathologists’ label.

