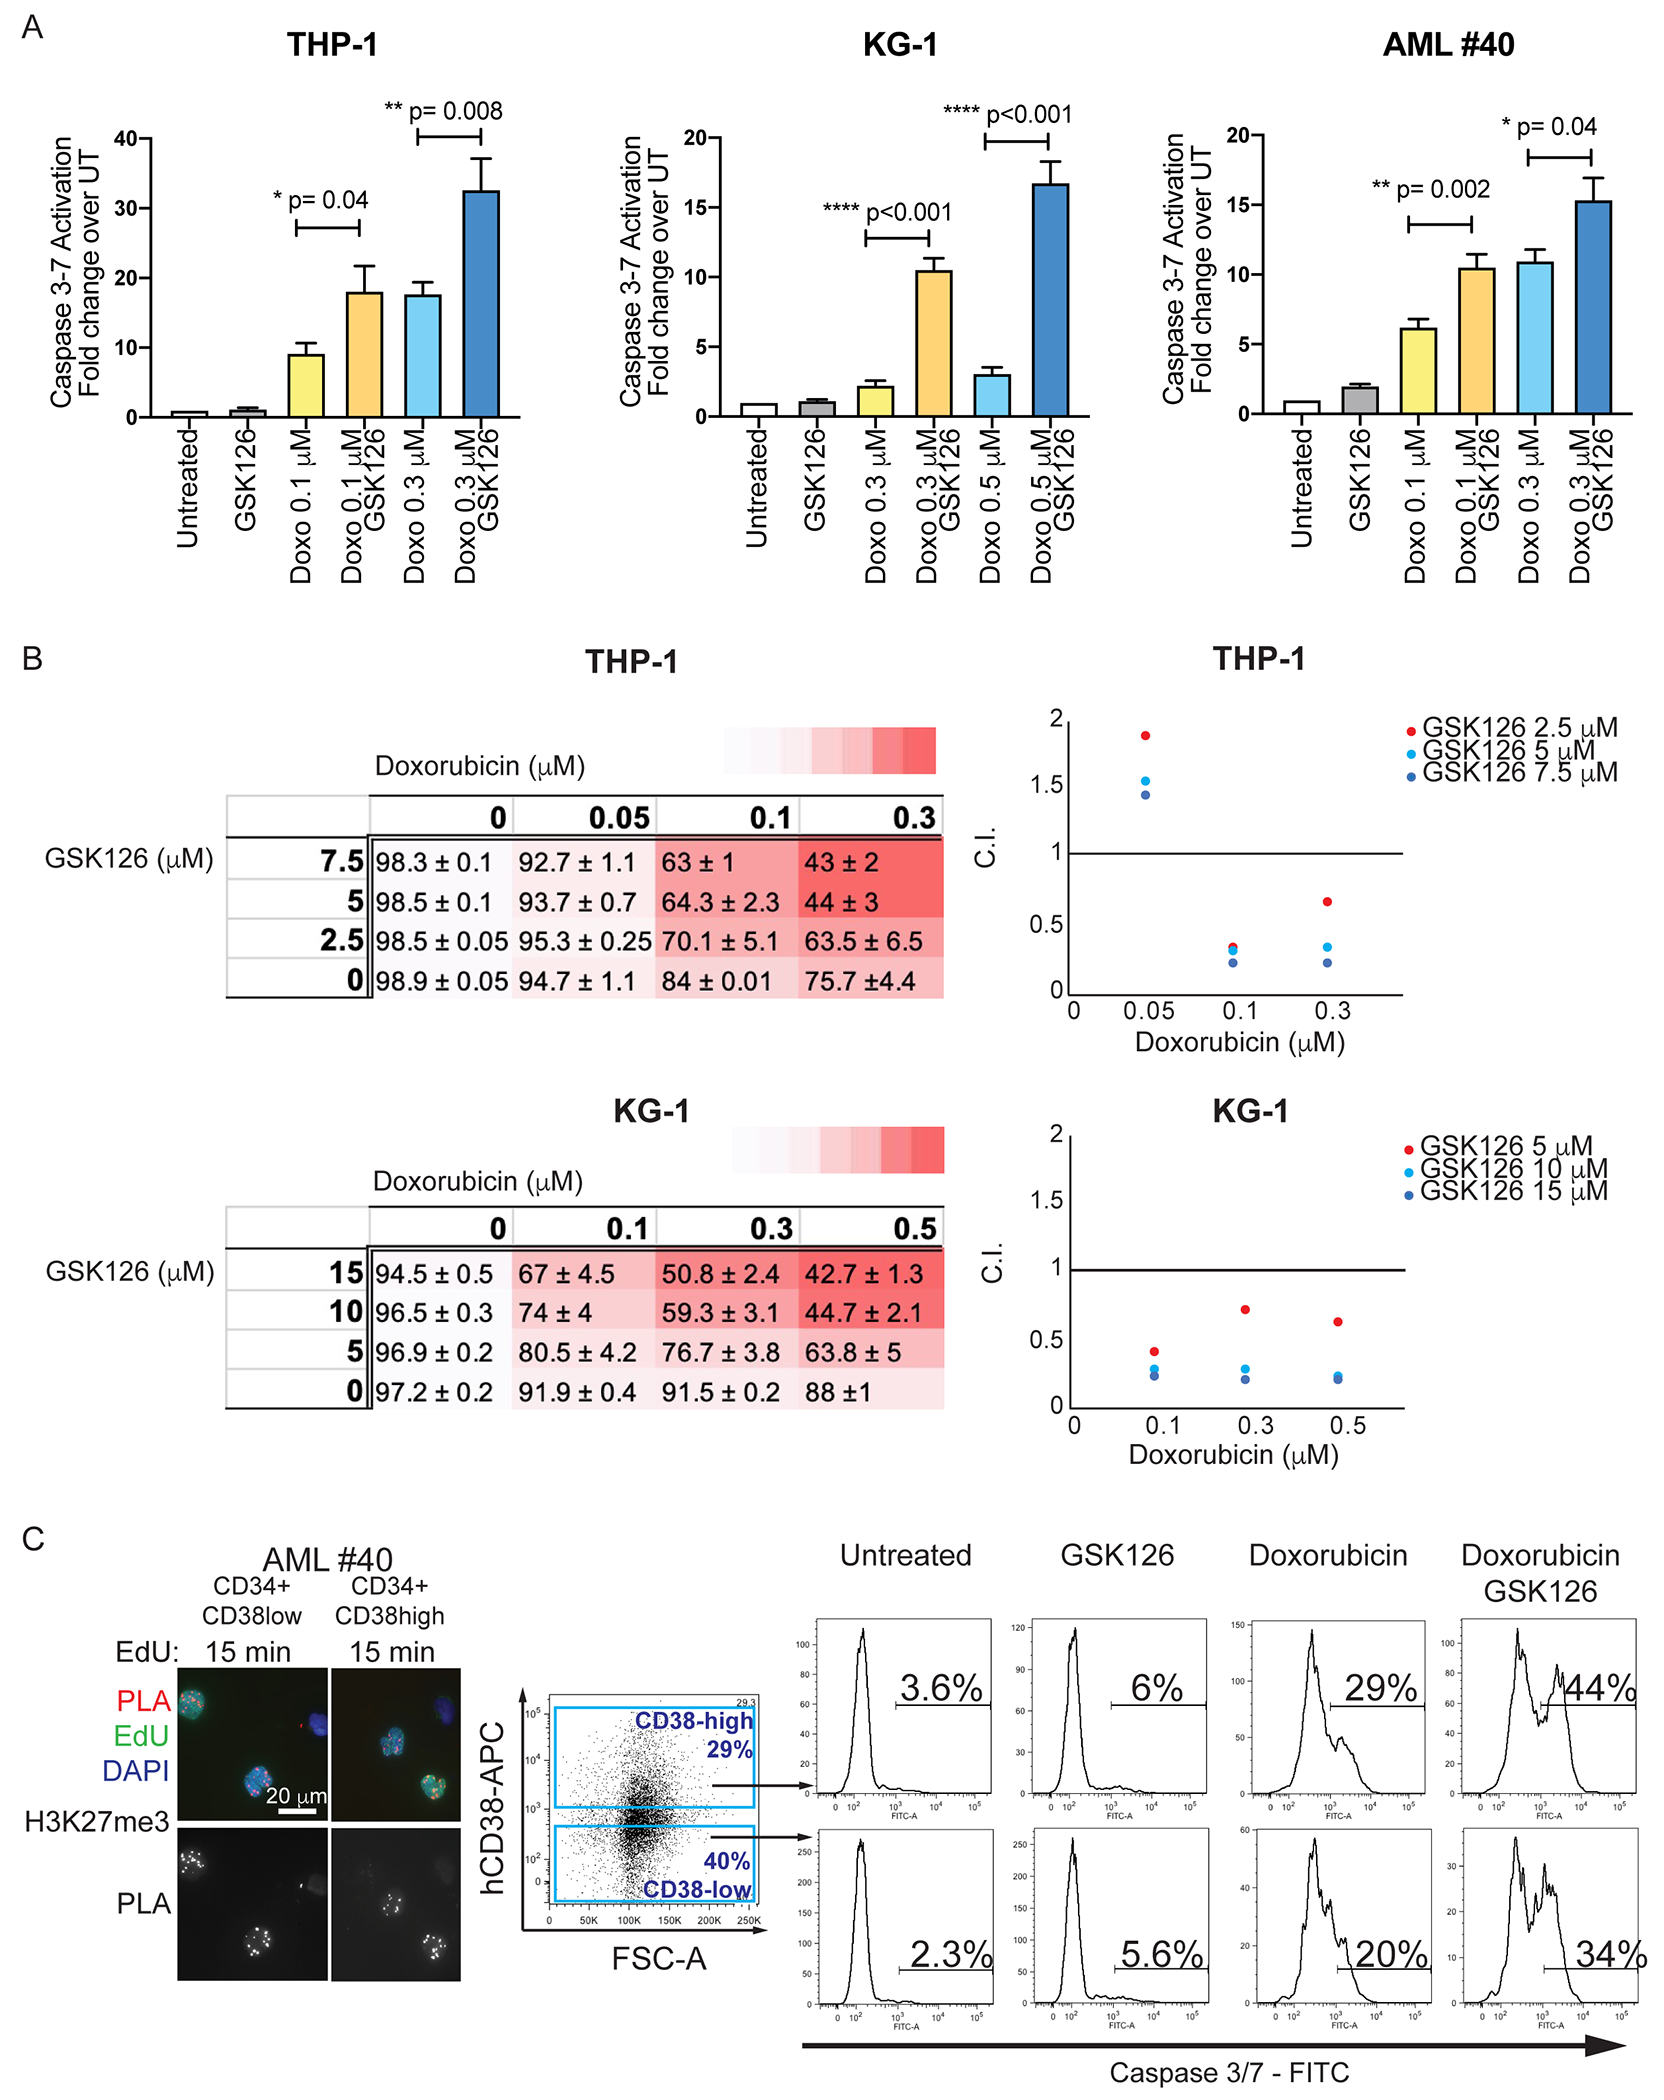
Figure 3. EZH2 inhibition enhances apoptosis of cytotoxic agent-treated AML cells.

(A) THP-1, KG-1, and CD34+ AML primary cells (sample #40) were treated with Doxo alone (0.1 μM, 0.3 or 0.5 μM), or in combination with GSK126 (5 μM), for 48 hr. Apoptosis (Caspase 3/7 activity) was analyzed by flow cytometry. Graph bars represent fold change +/− SEM in the % of Caspase 3/7 activation over the untreated control. Unpaired t-test: p<0.05; **p<0.01; ***p<0.001; (B) Combination Indexes (C.I.) of GSK126/Doxorubicin-induced apoptosis in THP-1 and KG-1 cells. THP-1 or KG-1 cells were treated with three different concentrations of GSK126 and/or Doxorubicin. Left: Dose-response matrices showing % of viable cells (+/−SEM) after treatment with increasing doses of Doxorubicin, GSK126 and combinations of drug pair Doxo/GSK126. Colors in the dose-response matrices indicate different levels of responses (from white to red, decreasing viable cells) of THP-1 and KG-1 cells. Right: Viability data elaborated using CompuSyn software to calculate C.I. plotted on the Y-axis of a 2D graph. The X axes show increasing concentrations of Doxorubicin, while the different colors indicate increasing concentrations of GSK126 (see labels). (C.I.= 0.90-1.10 indicates additive effects; C.I.=0.1-0.9 indicates synergistic effects). (C) H3K27me3 accumulation on nascent DNA (left) and Caspase 3/7 activation in AML sample #40 CD34+CD38high or CD34+CD38low cells treated with GSK126 (5 μM), Doxorubicin (0.1 μM), or the two drugs in combination.
