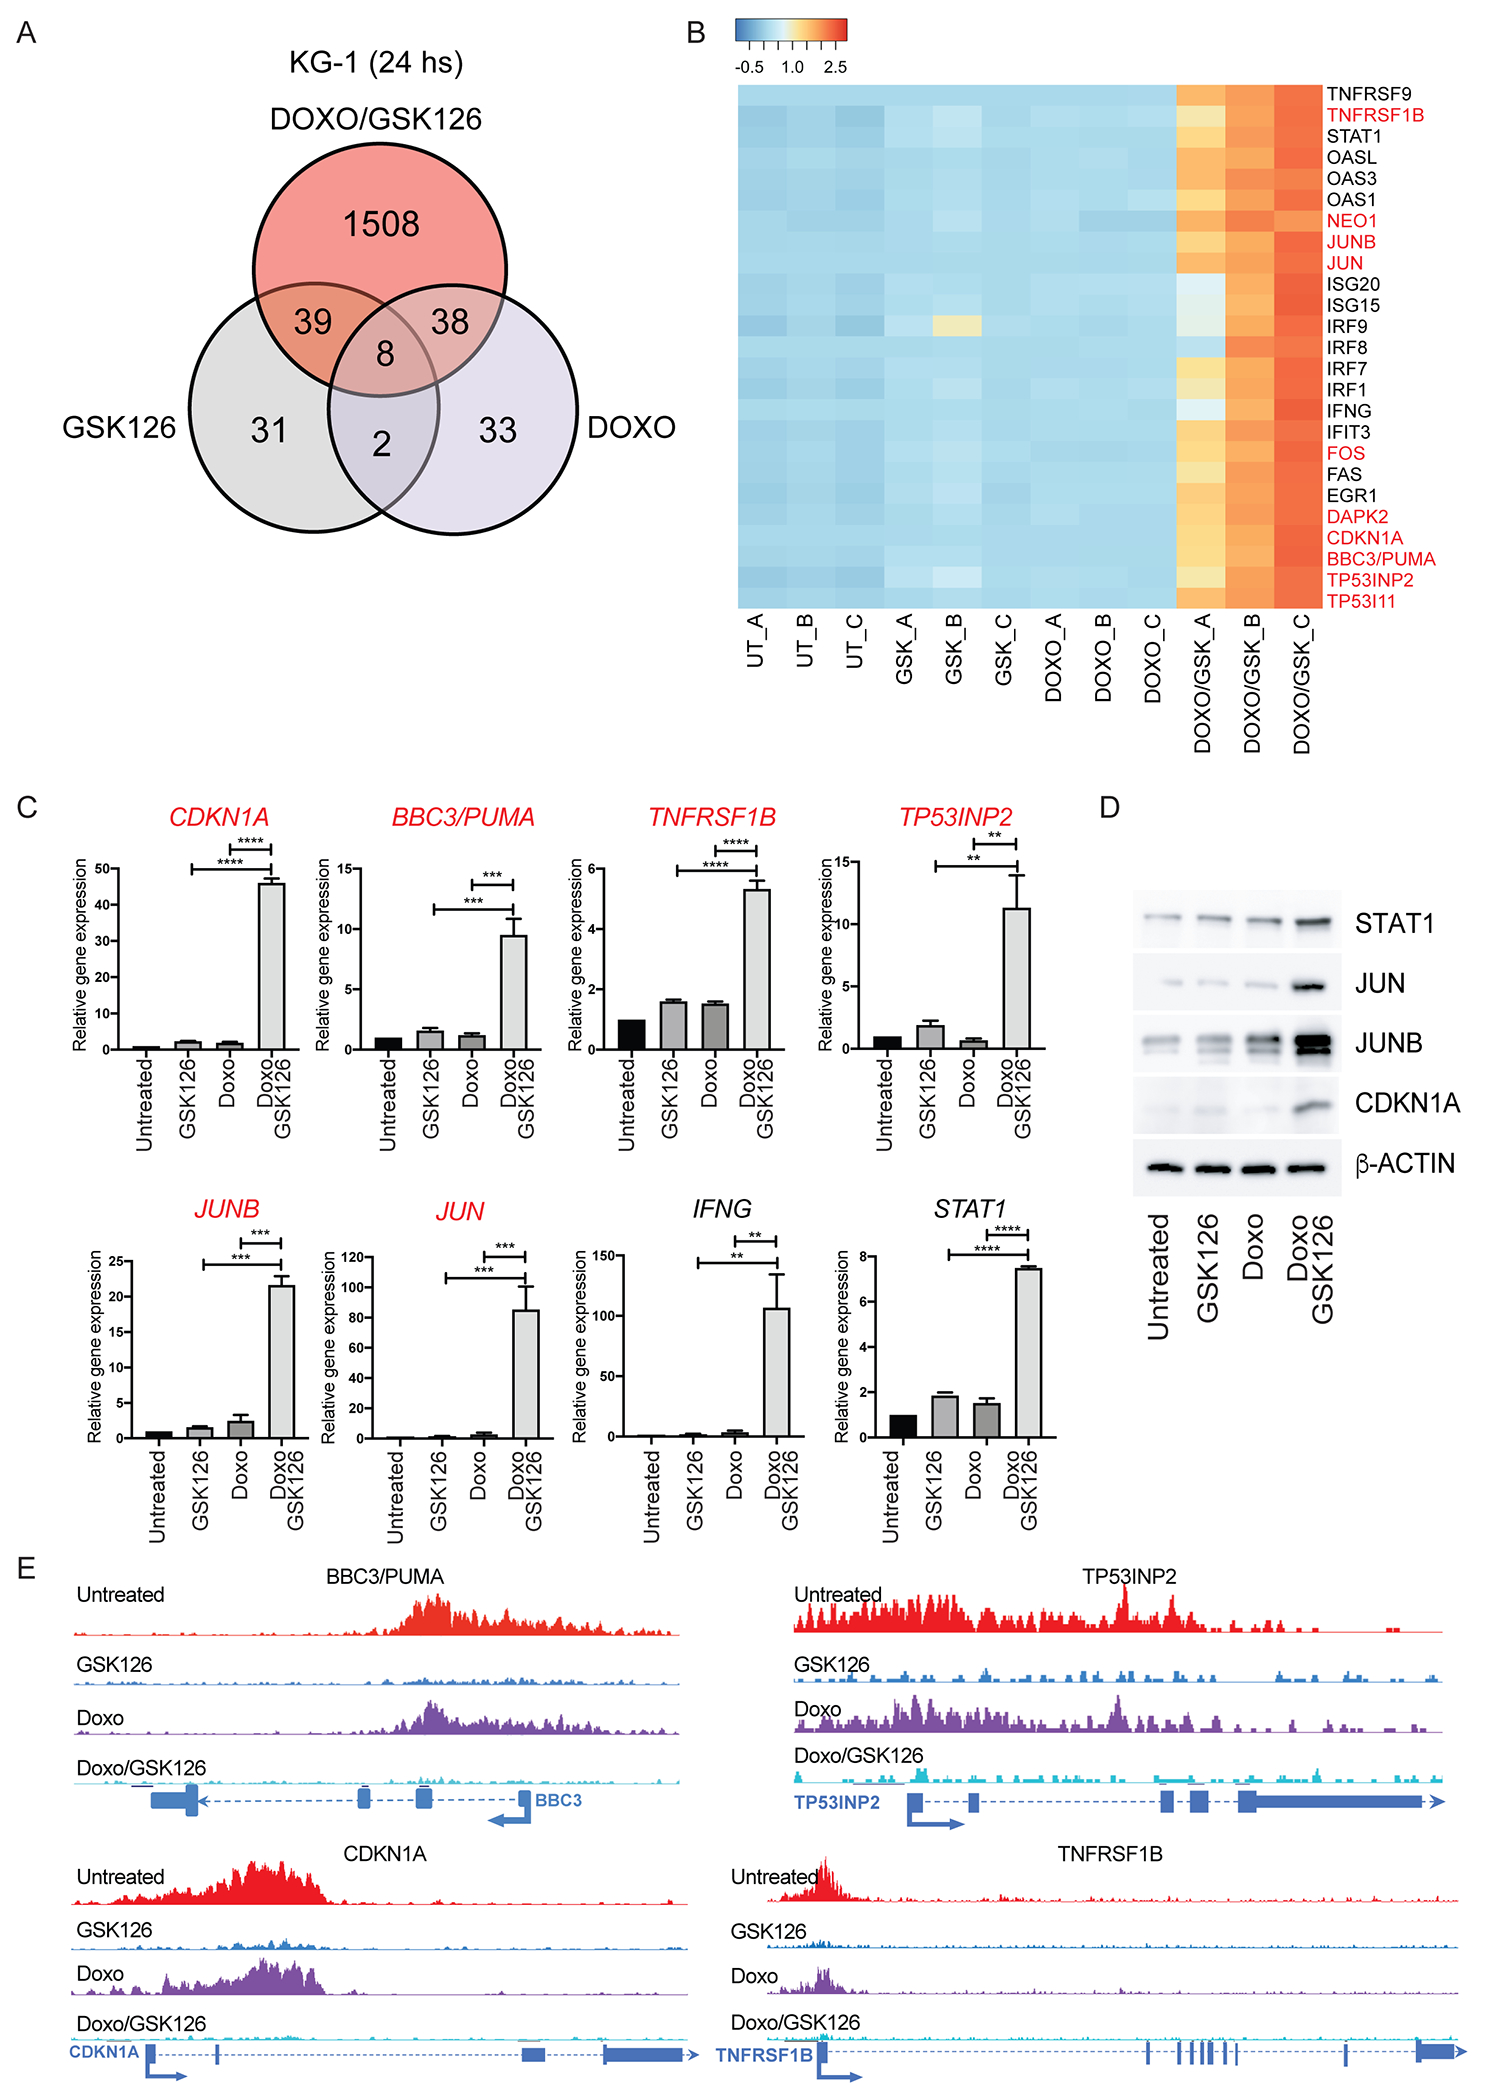
Figure 5. Gene subset regulated by GSK126/Doxo treatment in the KG-1 cell line.

(A) Venn diagram of genes differentially expressed in GSK126/Doxo-treated vs. Doxo- or GSK126-treated KG-1 cells; (B) Heat-map of genes selectively regulated by GSK126/Doxo compared to untreated or single GSK126 or Doxo treatments; (C) qPCR analysis of selected genes differentially regulated by GSK126/Doxo treatment. Data represent mean + SD of three independent experiments. Statistical analysis: one way ANOVA with Bonferroni’s correction; **p<0.01, ***p<0.001, ****p<0.0001; (D) Western blot analysis of selected genes overexpressed in GSK126/Doxo-treated cells; (E) Examples of four genes from H3K27me3 ChIP-seq in KG-1 cells showing loss of H3K27me3 marking after GSK126 or GSK126/Doxo treatment. Genes labeled in red in the heat-map and in the q-PCR experiments (B, C, D) exhibit loss of H3K27me3 marking after GSK126 or GSK126/Doxo treatment.
