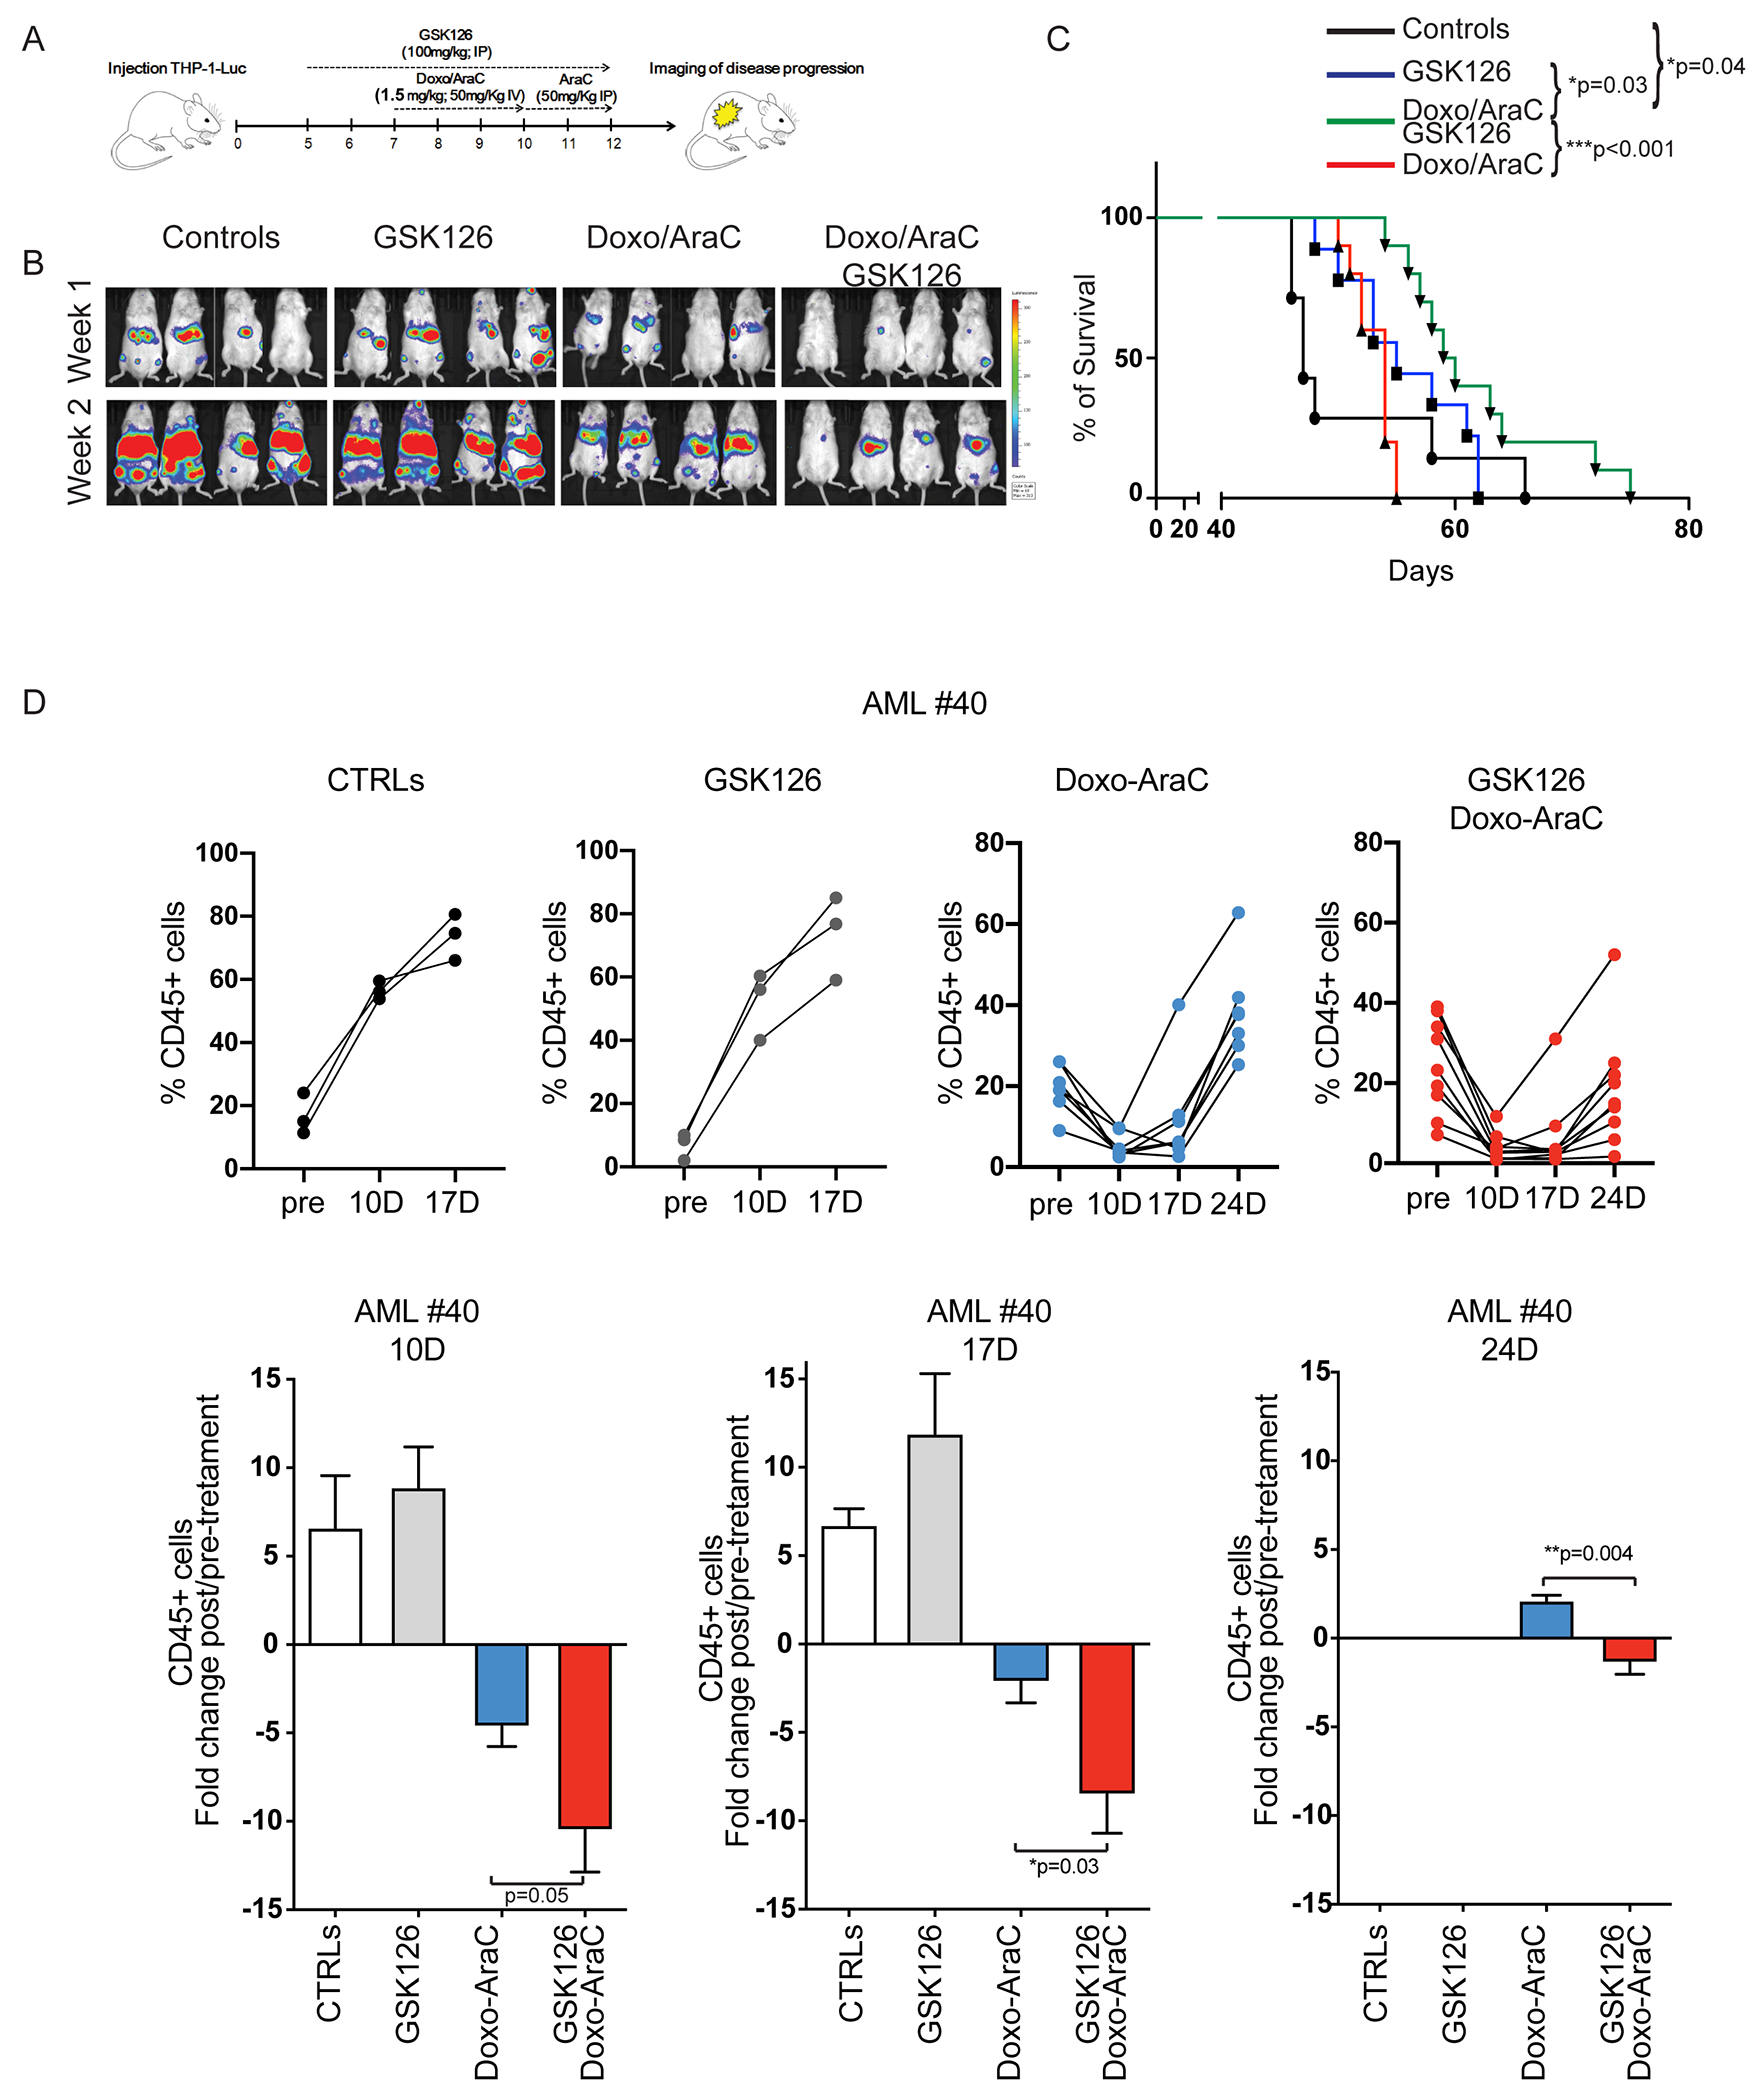
Figure 6. Leukemia burden and survival of chemotherapy and/or GSK126-treated immunodeficient mice injected with AML cells.

(A) Drug treatment and imaging protocol of NRG mice injected with THP-1 Luciferase+ cells (1 x10⁶/mouse). 5 days post-injection, mice were left untreated (controls), treated with GSK126 alone for 7 days (GSK126 group), or pre-treated (2 days) with GSK126 and co-treated with GSK126 and chemotherapy for 5 additional days (Doxo/AraC/GSK126 group); the Doxo/AraC only group was treated for 5 days, starting 7 days post THP-1 cell injection. (B) Mouse serial bioluminescence images acquired 1 and 2 weeks after the end of treatment; drug treatments are indicated at top. (C) Kaplan-Meier survival curves for all four cohorts (control and three drug treatment regimens) of NRG mice injected with THP-1 cells. Long-rank test: *p<0.05, **p<0.01. (D) Leukemia burden of untreated and drug-treated NRG-SGM3 mice injected with primary AML cells. Mice were injected with AML sample #40 (1.5x 10⁶ cells/mouse). When peripheral blood human CD45-positive cells were >10%, mice were divided in 4 groups and treated with vehicle, GSK126, Doxo/Ara-C, or the GSK126/Doxo/Ara-C combination; leukemia burden was assessed by measuring the percentage of peripheral blood leukemic cells by anti-human CD45-FITC flow cytometry at one-week interval starting 10 days after therapy cessation. Upper row, leukemia load shown as percentage of CD45+ cells in individual mice; lower row, fold changes of the percentage of leukemic cells in pre-treated vs treated mice in each cohort. Unpaired t-test *p<0.05, **p<0.01.
