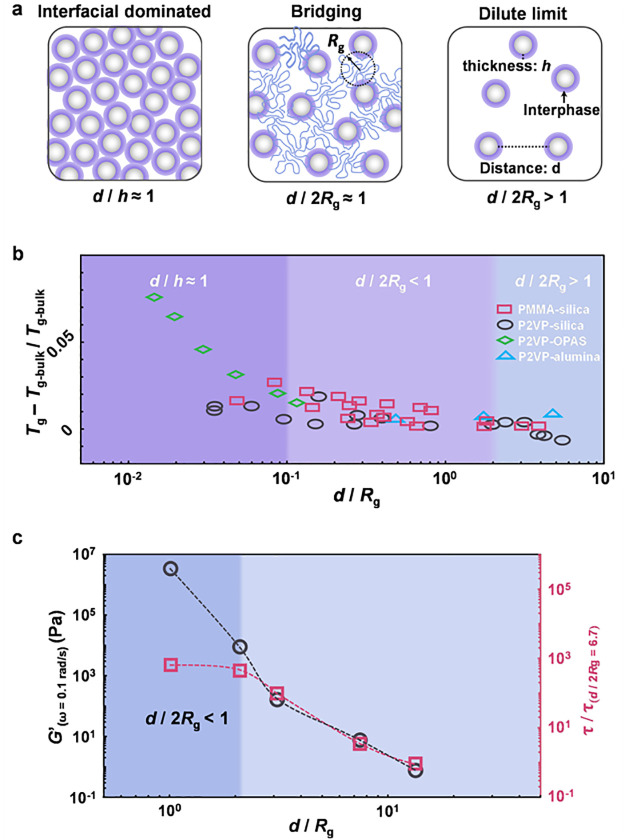
Figure 3.
Size effects of the interphase in nanocomposites. (a) Schematics of the different regimes for size effects of the interphase. (b) Effect of interparticle separation distance on the Tg values of nanocomposites. These data are gathered from refs (14 and 74−78). (c) Relaxation times of nanoparticles (τ) and the storage modulus (G′) in the nanocomposites obtained determined at ω = 0.1 rad/s. Reprinted with permission from refs (72 and 73). Copyright 2017 and 2018 American Physical Society.

