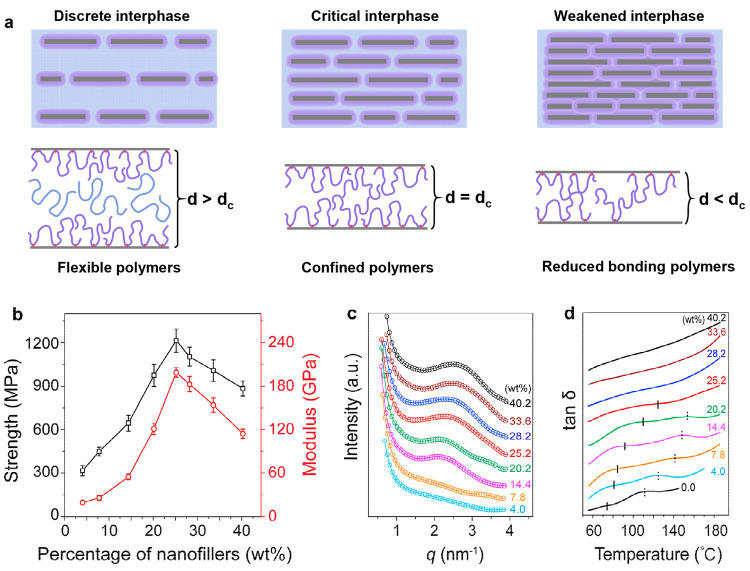
Figure 4.
Effects of the interphase spacing on nanocomposites. (a) Schematic diagram illustrating the interphase between the aligned nanosheets at different interlayer distances. The strength and modulus (b), plots of the diffraction vector (c), and curves of tan δ versus temperature (d) of nanocomposite films with the filling amount of nanofillers.

