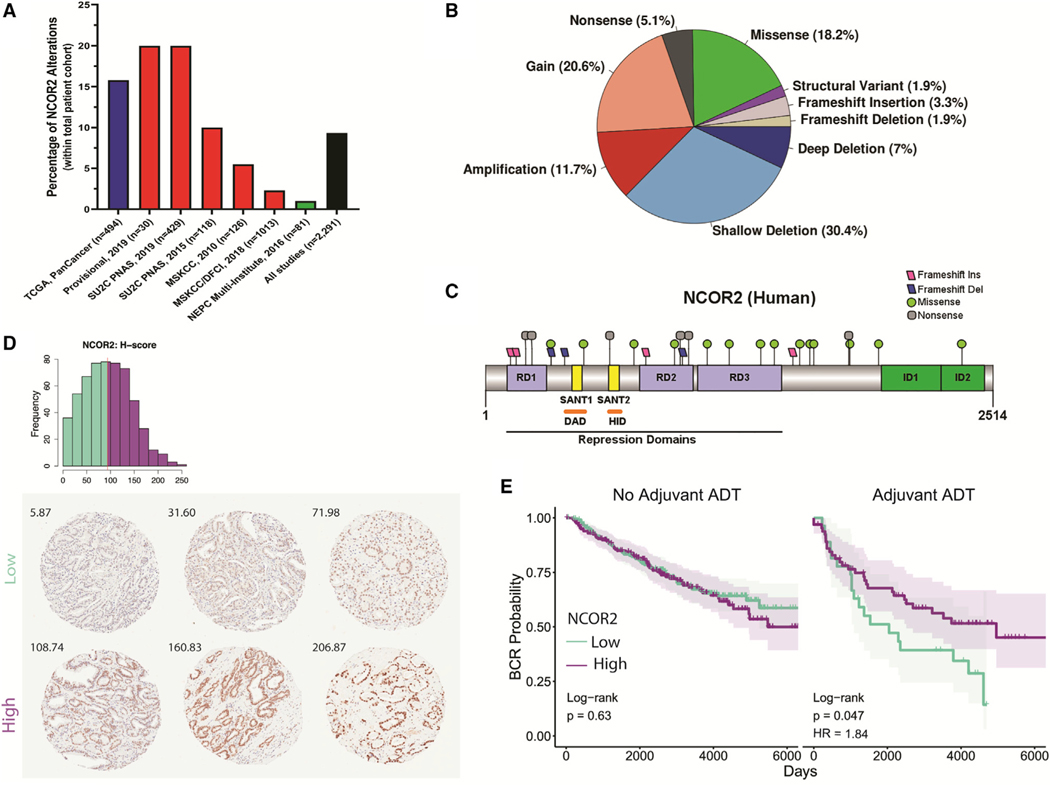
Figure 1. NCOR2 status in clinical samples.
(A) Percent of adenocarcinoma (Cancer Genome Atlas Research Network, 2015) (blue), metastatic (Abida et al., 2019, Robinson et al., 2015a, Armenia et al., 2018, Taylor et al., 2010) (red), and neuroendocrine (Beltran et al., 2016) (green) PC patient samples with NCOR2 genomic alterations.
(B) Proportion of NCOR2 mutation and alteration types from (A) (n = 2,291).
(C) Distribution of mutations along the human NCOR2 protein; RD, repression domain; SANT, SW13/ADA2/NCOR/TFIIB-like domain; DAD, deacetylase-activating domain; HID, histone-interacting domain; ID, protein interaction domain.
(D) Distribution of protein expression (H score) by IHC in the RPCCC PC TMA. The red line indicates median expression; NCOR2-low tumors, green; NCOR2-high tumors, purple. Representative tissue cores and H scores from six individual patients showing low and high nuclear staining of NCOR2 (below).
(E) BCR survival assessment of patients with high and low NCOR2 that did or did not receive adjuvant ADT with RP. Significance of Cox proportional hazards regression (log rank test); significant shifts in survival (HR, hazard ratio).

