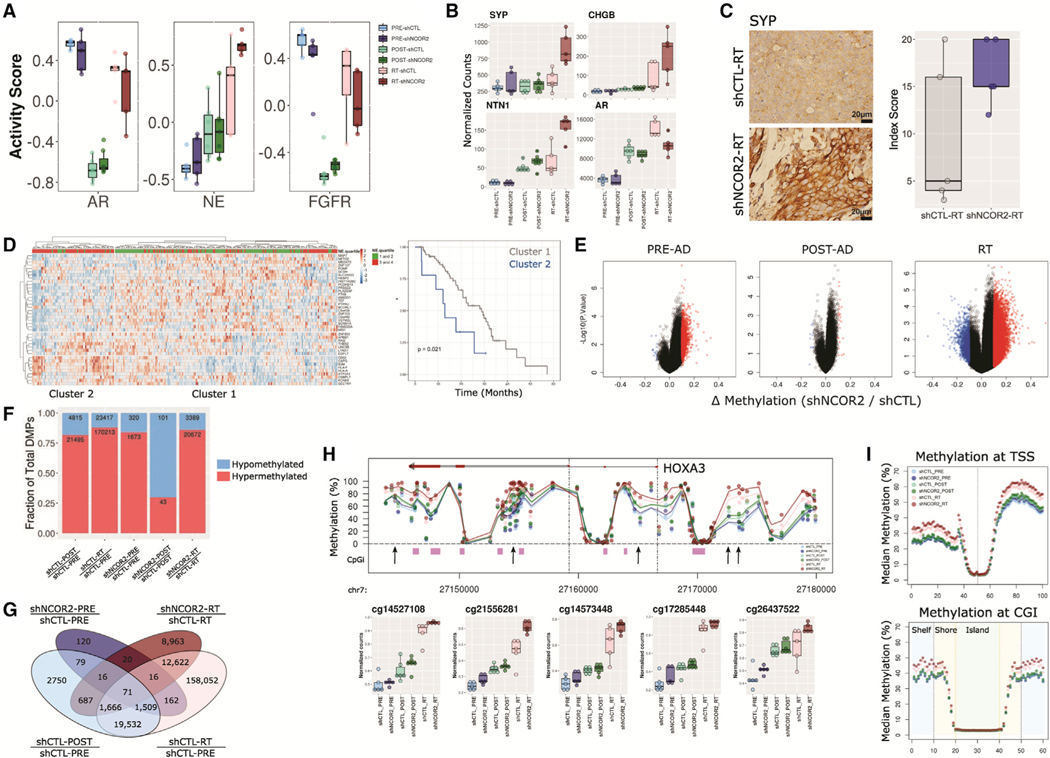
Figure 3. NCOR2 loss accelerates the molecular features of ADT resistance during PC progression in vivo.
(A) Gene set variation analysis of established pathways associated with ADT-R in PC.
(B) Gene expression profiles for SYP, CHGB, NTN1, and AR in CWR22 groups.
(C) IHC showing representative examples of SYP expression in shCTL-RT and shNCOR2-RT samples (left); scale bars, 20 μm. Quantification of IHC in RT is shown on the right. Data are summarized as boxplots representing lower, middle, and upper quartiles. Whiskers indicate maximum and minimum values, excluding outliers defined as 1.5× IQR (A–C).
(D) Heatmap of scaled expression depicting the 41 most significant DEGs in NCOR2-low relative to NCOR2-high tumors within the SU2C cohort that were also identified in RT-shNCOR2 (left). Column annotations show grouped neuroendocrine scores (NE.quartiles) for each tumor. Kaplan-Meier curves of overall survival proportions between major tumor clusters are identified.
(E) Volcano plots depicting NCOR2-dependent DMPs (red = upregulated, blue = downregulated) determined at different stages of disease.
(F) Proportion of DMPs in each comparison; hypermethylated, red; hypomethylated, blue.
(G) Total number of NCOR2 and stage-specific DMPs in PRE-ADT and RT.
(H) Representative genomic view of the HOXA3 locus showing the average methylation levels within each CWR22 group; CpG island regions, purple; arrows, example DMPs; mean value, black dot; IQR, horizontal lines.
(I) Binning analysis depicting the median methylation calculated for genomic regions relative to TSS (top) and CpG island (bottom) loci. For TSS, each bin represents 100 bp, with the TSS centered at bin 50. For CpG islands, shore (orange) and shelf (blue) bins represent 200 bp, while islands (green) are variable depending on genomic length but centered on bin 30.

