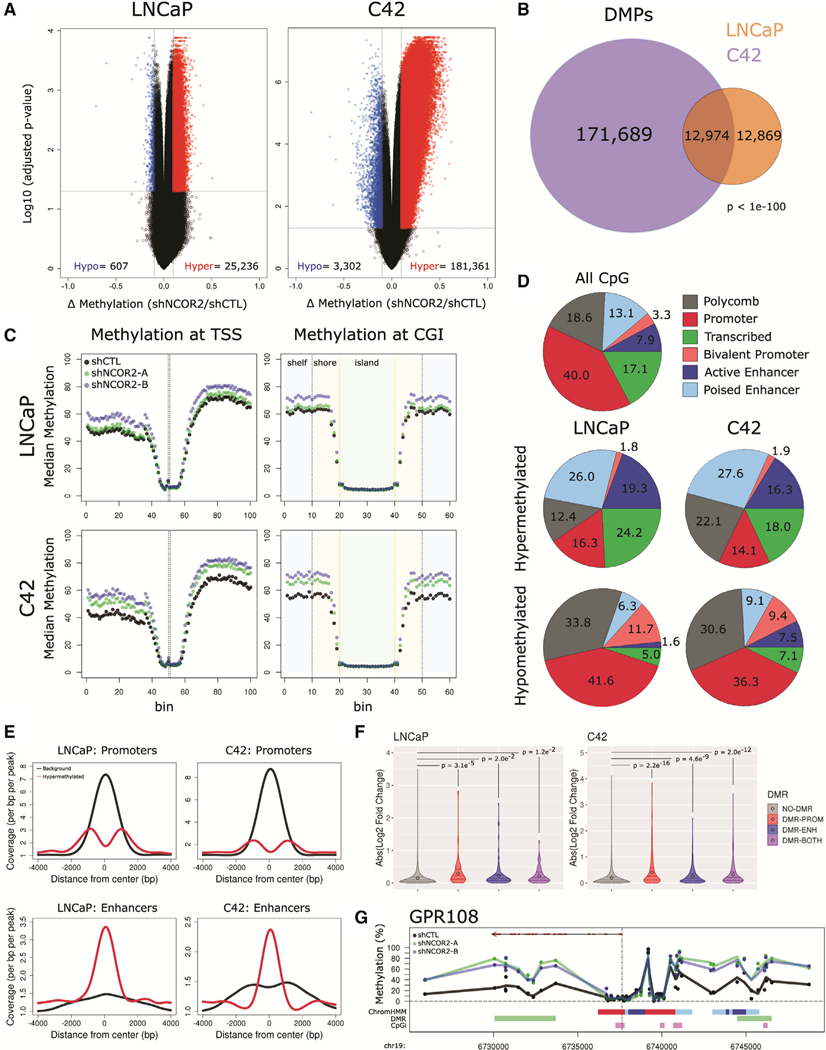
Figure 5. NCOR2 loss results in a hypermethylation phenotype in LNCaP and C4–2 cells.
(A) Volcano plots representing DMPs following NCOR2 knockdown in LNCaP (left) and C4–2 (right) cells, hypomethylated, blue; hypermethylated, red.
(B) Venn diagram of DMPs identified in each cell.
(C) Binning analysis depicting the median methylation calculated for genomic regions relative to TSS (left) and CpG island (right) loci. For TSS, each bin represents 100 bp, with the TSS centered at bin 50. For CpG islands, shore (orange) and shelf (blue) bins represent 200 bp, while islands (green) are variable depending on genomic length but centered on bin 30.
(D) Relative proportions of all CpGs (top) or DMPs (middle, bottom) that annotate to ChromHMM regions.
(E) Peak centered densities of non-DMP CpG sites (black) or hypermethylated DMPs (red) centered at ChromHMM promoter or enhancer regions.
(F) Comparison of NCOR2 knockdown gene expression changes annotated with DMR promoters and/or DMR enhancers relative to genes not annotated. Distributions are compared by Kolmogorov-Smirnov (KS) test. Mean value (black dot) and IQR (horizontal lines) are shown.
(G) Representative genomic view of an NCOR2-dependent gene locus with annotated enhancer hypermethylation (GPR108). Tracks (from top), RefSeq gene (exons [red] and introns [black]); methylation detected in shCTL (black) or shNCOR2 C4–2 cells (green, blue); ChromHMM regions (color code is the same as shown in [D]); DMR regions (green); CpG island regions (purple).

