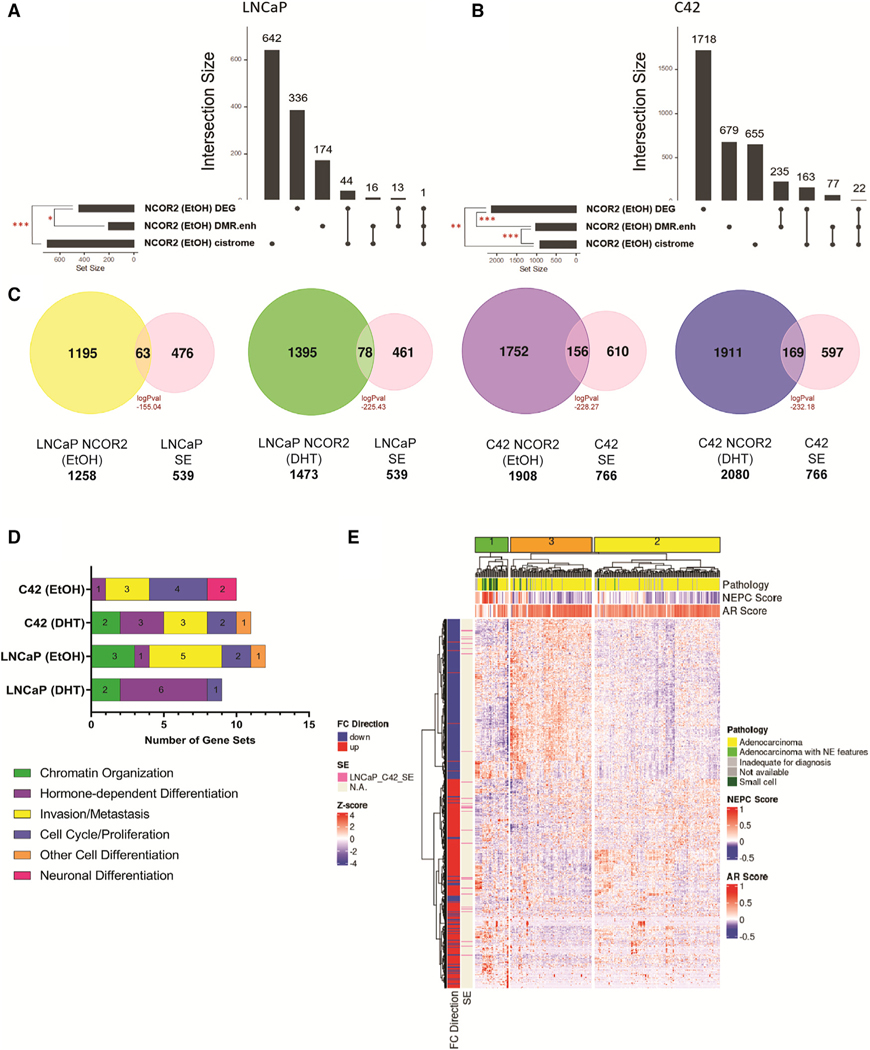
Figure 7. Data integration identifies effects on SEs.
(A and B) Upset plot showing the intersection between DEGs upon NCOR2 knockdown, expressed genes associated with differentially methylated enhancer regions upon NCOR2 knockdown (DMR.enh), and expressed genes associated with NCOR2 binding found under basal (EtOH) conditions in both LNCaP (A) and C4–2 (B) cells. Significant overlaps are denoted by a red asterisk (*p < 0.05; **p < 0.01; ***p < 0.001).
(C) Overlaps of NCOR2 binding by ChIP-seq with identified SEs from LNCaP and C4–2 cells. Peak overlaps are shown for both basal (EtOH) and androgen-supplemented (DHT) conditions, and significance was determined by hypergeometric distribution.
(D) Functional enrichment analysis of genes annotated to NCOR2/SE shared regions from (C). The top 15 significant (p adjusted < 0.05) gene sets that related to the functional categories (cell differentiation, chromatin organization, proliferation, and metastasis) are displayed as counts within their respective functional category.
(E) Heatmap showing the expression levels of DEGs from CWR22 shNCOR2 recurrent tumors compared with control recurrent tumors (1,189) and the scaled expression (Z score) of those genes in mCRPC patient samples. The column annotations indicate pathology classification (Pathology), NEPC score, and AR signaling score (AR score). The row annotations indicate FC direction of CWR22 recurrent tumor DEGs (shNCOR2 compared with shCTL) and if that gene is regulated by an SE (identified in LNCaP and C4–2 cells).

