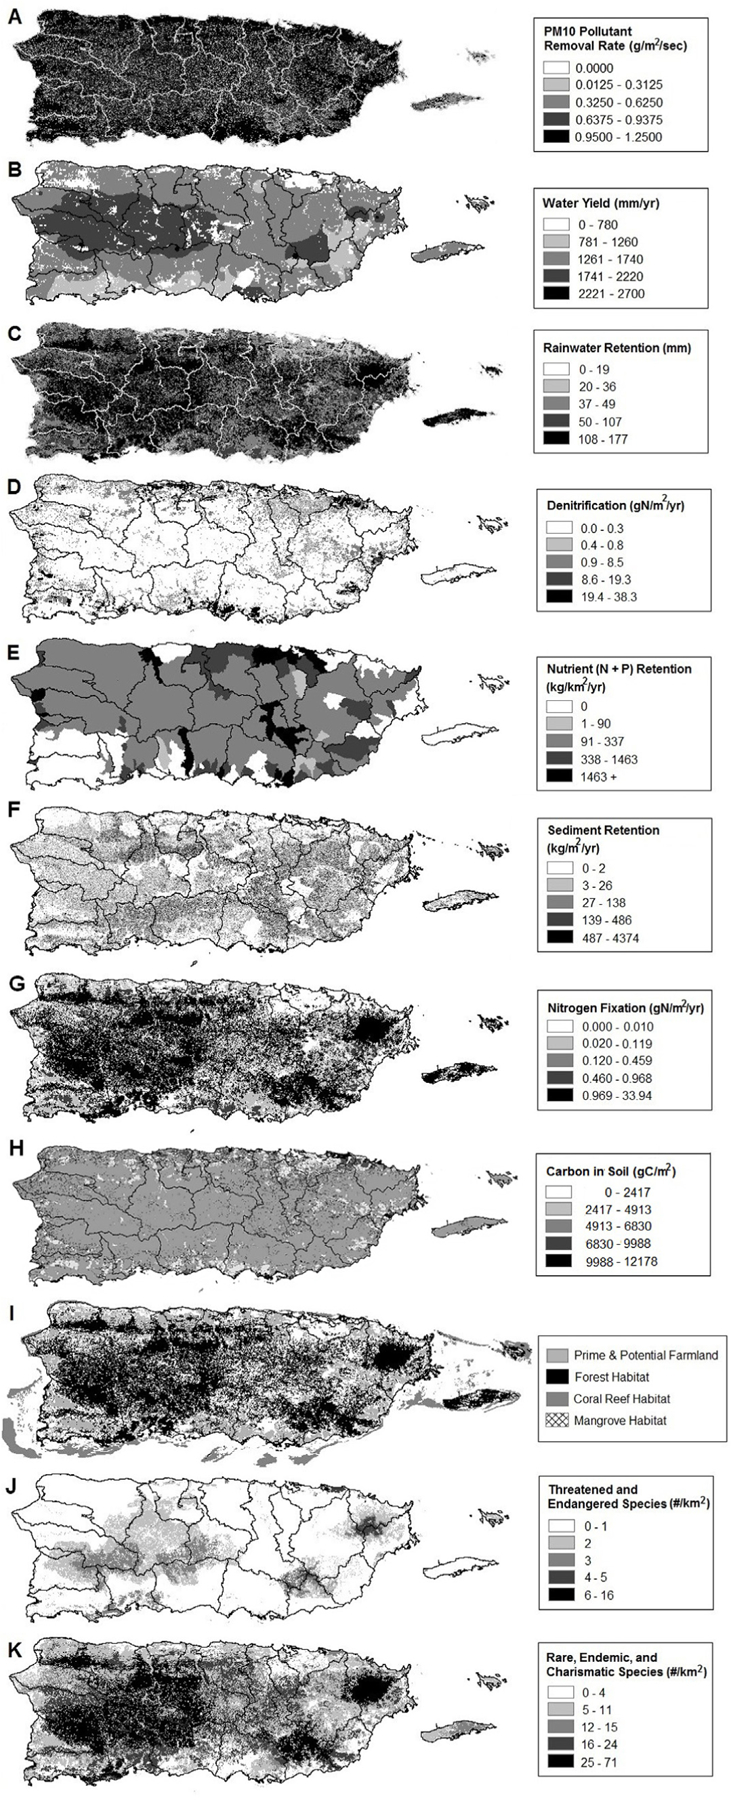
Fig. 2.

Maps of ecosystem service supply (Table 3) across Puerto Rican watersheds. Nitrogen retention and phosphorous retention were highly correlated and combined to a single map (E). For convenience, ecosystem services defined by discrete habitat metrics (forest, farmland, coral, and mangroves) were also combined to a single map (I). Tree canopy for shading is based on% canopy cover, as is the map of pollutant removal (A), and is therefore not shown separately. Finfish stock and marine recreation map directly onto benthic habitats (I) and are not shown separately.
