
Fig. 3.
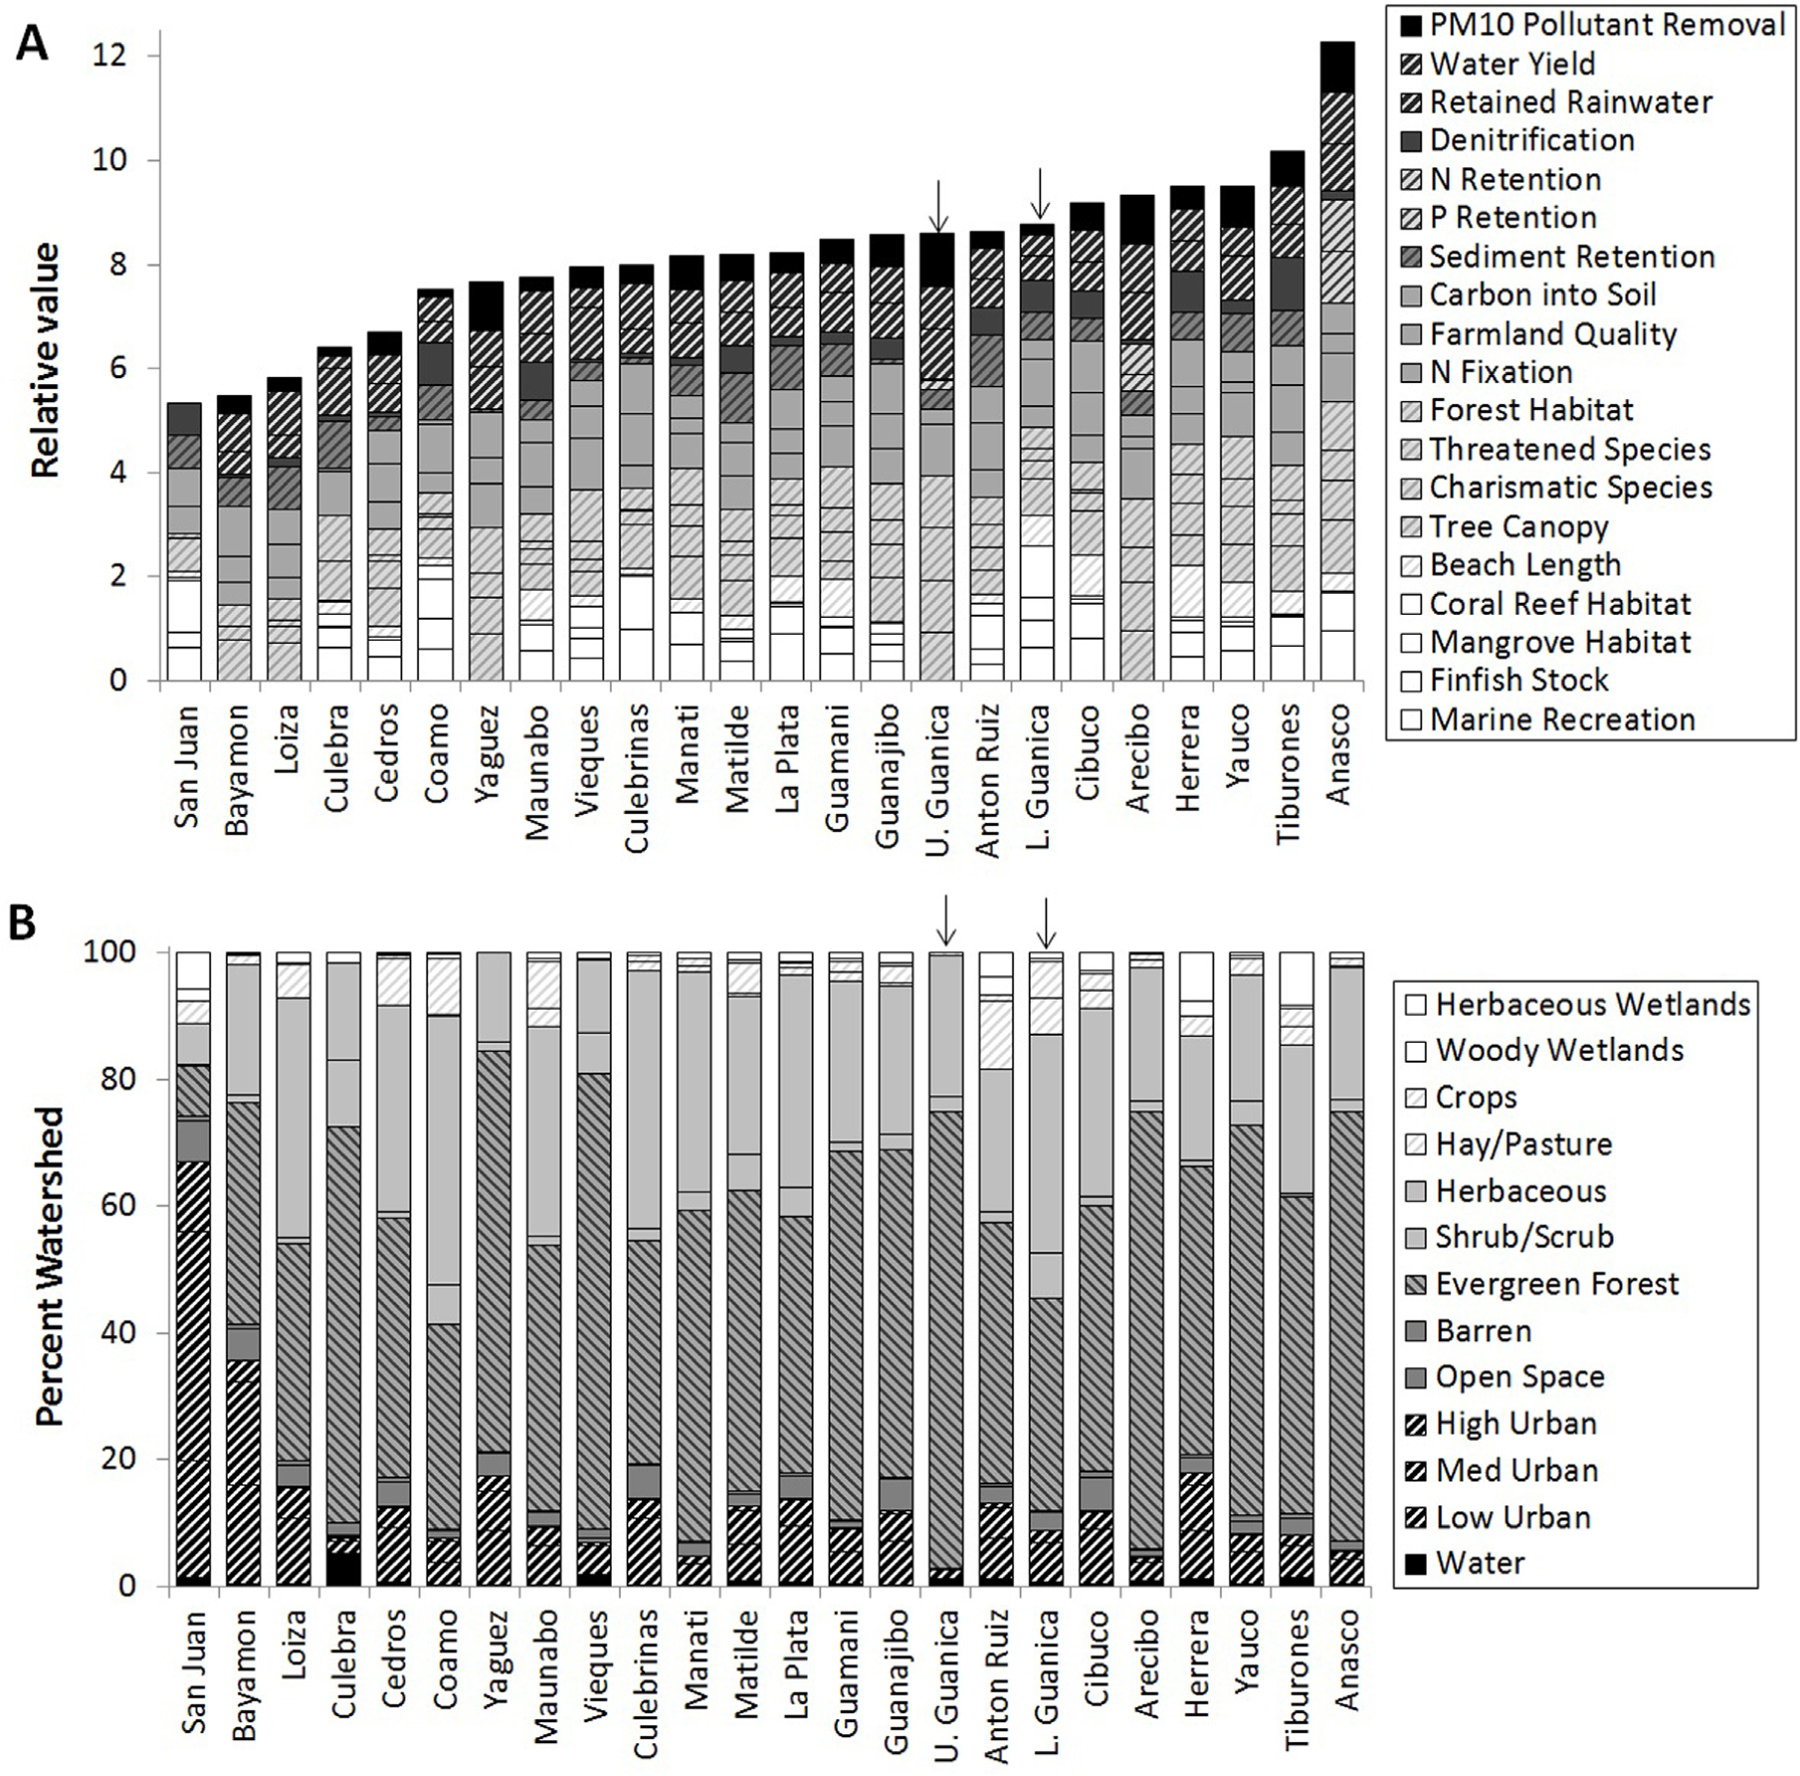
Relative values of (A) ecosystem service supply and (B) land cover in each Puerto Rico watershed. Ecosystem services metrics were linearly scaled from 0 to 1 based on the minimum and maximum of each across all of Puerto Rico. Arrows indicate Upper and Lower Guánica study areas.