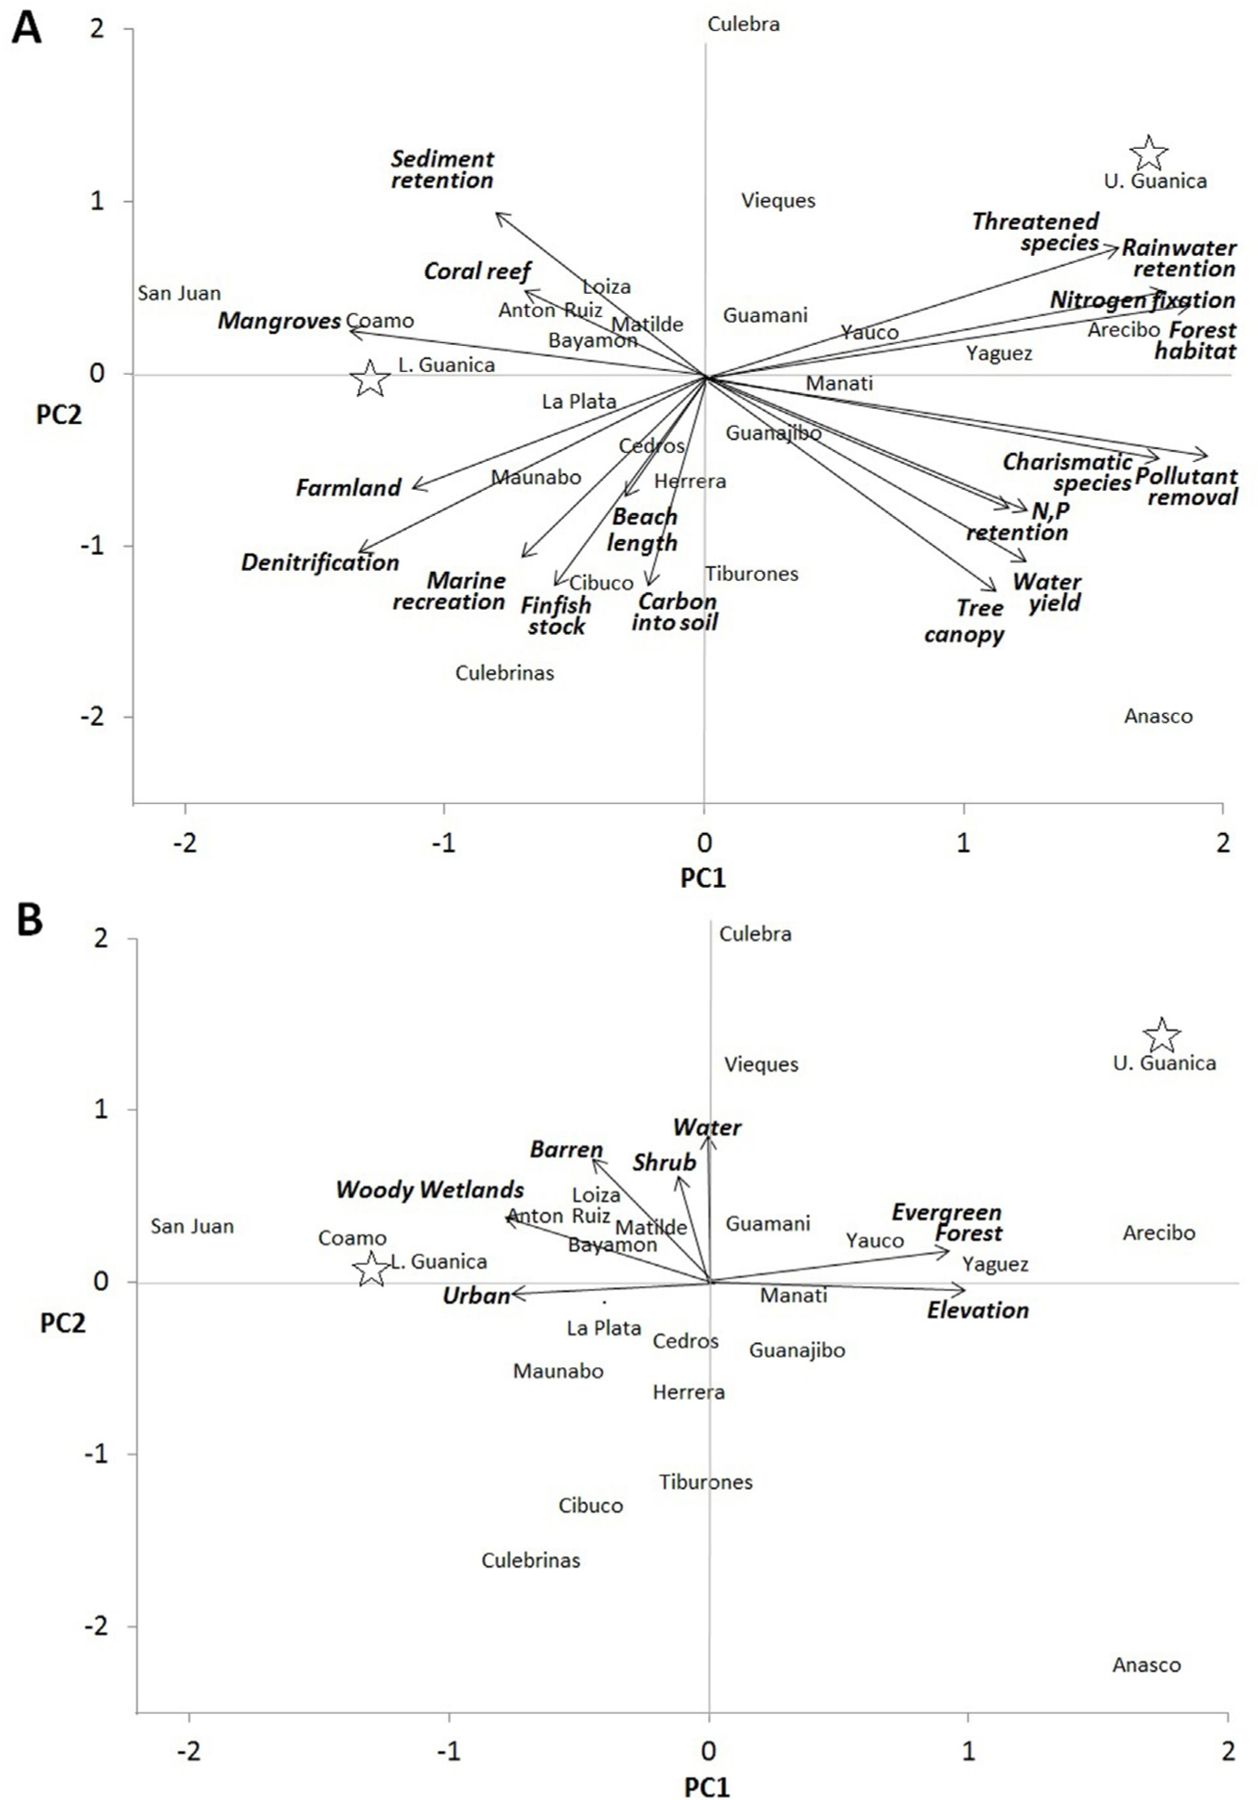
Fig. 4.

Ordination plot showing the distribution of watersheds along the first two factors identified in PCA. The direction of the arrows indicates (A) the ecosystem services metrics and (B) the environmental variables that were correlated with a given PC axis.
