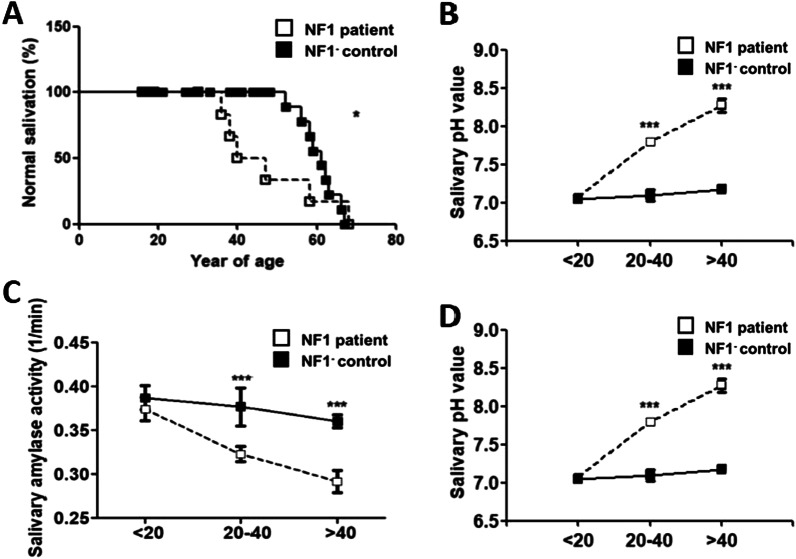
Fig. 2.
Comparison of salivary changes among NF1 patients and NF1-controls. A Prevalence of decreased salivary flow rate among NF1 patients and NF1- controls (OR = 1.40, 95% CI = 1.05–1.76, P = 0.005). B Whole unstimulated salivary flow rates among NF1 patients and NF1- controls. Y axis represented flow rates (ml/min). X axis represented age of participants. C Salivary amylase activity among NF1 patients and NF1- controls. Y axis represented amylase activity (1/min). X axis represented age of participants. D Salivary pH values among NF1 patients and NF1- controls. Y axis represented pH values. X axis represented age of participants

