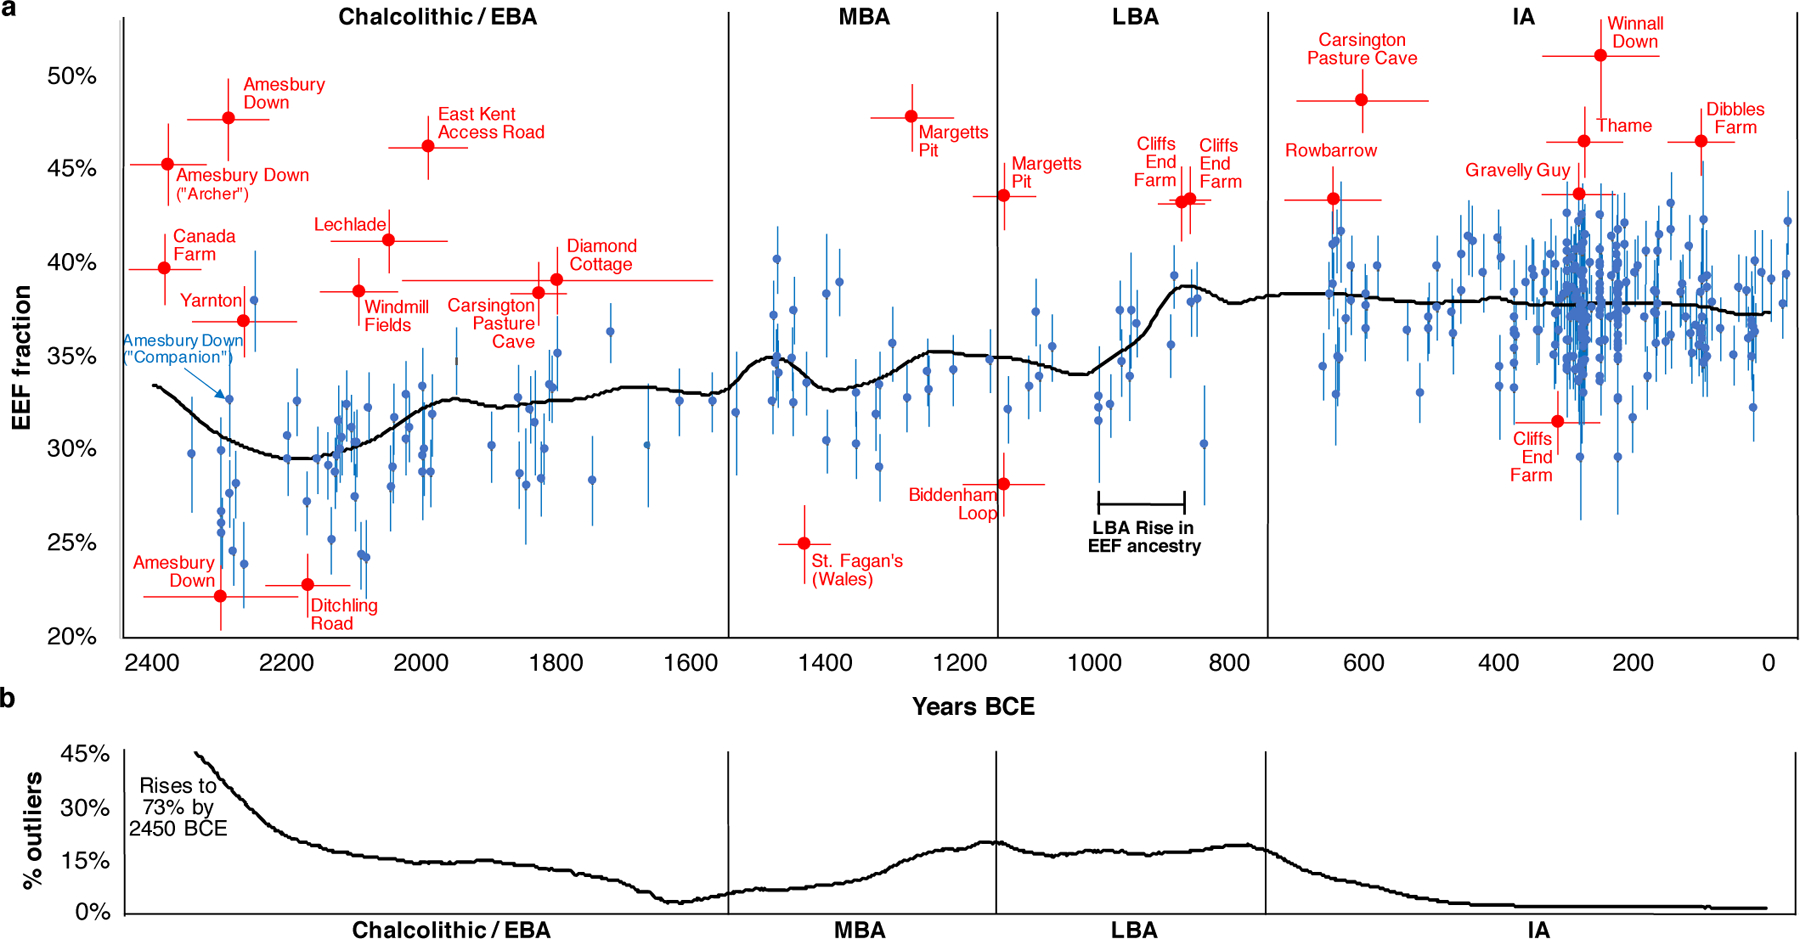
Fig. 3: By-individual analysis of the southern Britain time transect.

(A) Estimates of EEF ancestry and one standard error for all individuals fitting a three-way admixture model (EEF + WHG + Yamnaya) at p>0.01 using qpAdm; we restrict to 2450 BCE-43 CE using the best date estimate from Supplementary Table 5. Most individuals are in blue, while significant outliers at the ancestry tails are in red (outliers are identified as p<0.005 based on a qpWave test from the main cluster from their period and |Z|>3 for a difference in EEF proportion, or p<0.1 and |Z|>3.5). We use a horizontal bar to show one standard error for the date (Supplementary Table 5). The black line shows population-wide EEF ancestry at each time obtained by weighting each individual’s EEF estimate by the inverse square of their standard error and the probability that their date falls at that time (based on the mean and standard error in Supplementary Table 5 assuming normality; we filter out individuals with standard errors >120 years). The incorporation of increased EEF ancestry into the majority of individuals occurred ~1000–875 BCE. (B) Proportion of outliers over 300-year sliding windows centered on each point, based on randomly sampling dates of all individuals 100 times assuming normality and their mean and standard deviation in Supplementary Table 5 (removing individuals with EEF errors >0.022 and date errors >120 years). Major epochs of migration into Britain are periods with elevated proportions of outliers: between 2450–1800 BCE (17% outliers) and 1300–750 BCE (17% again). The fact that there was an elevated rate of outliers prior to the 1000–875 BCE population-wide rise in EEF ancestry may reflect a delay between the time of arrival of migrants and their full incorporation into the population.
