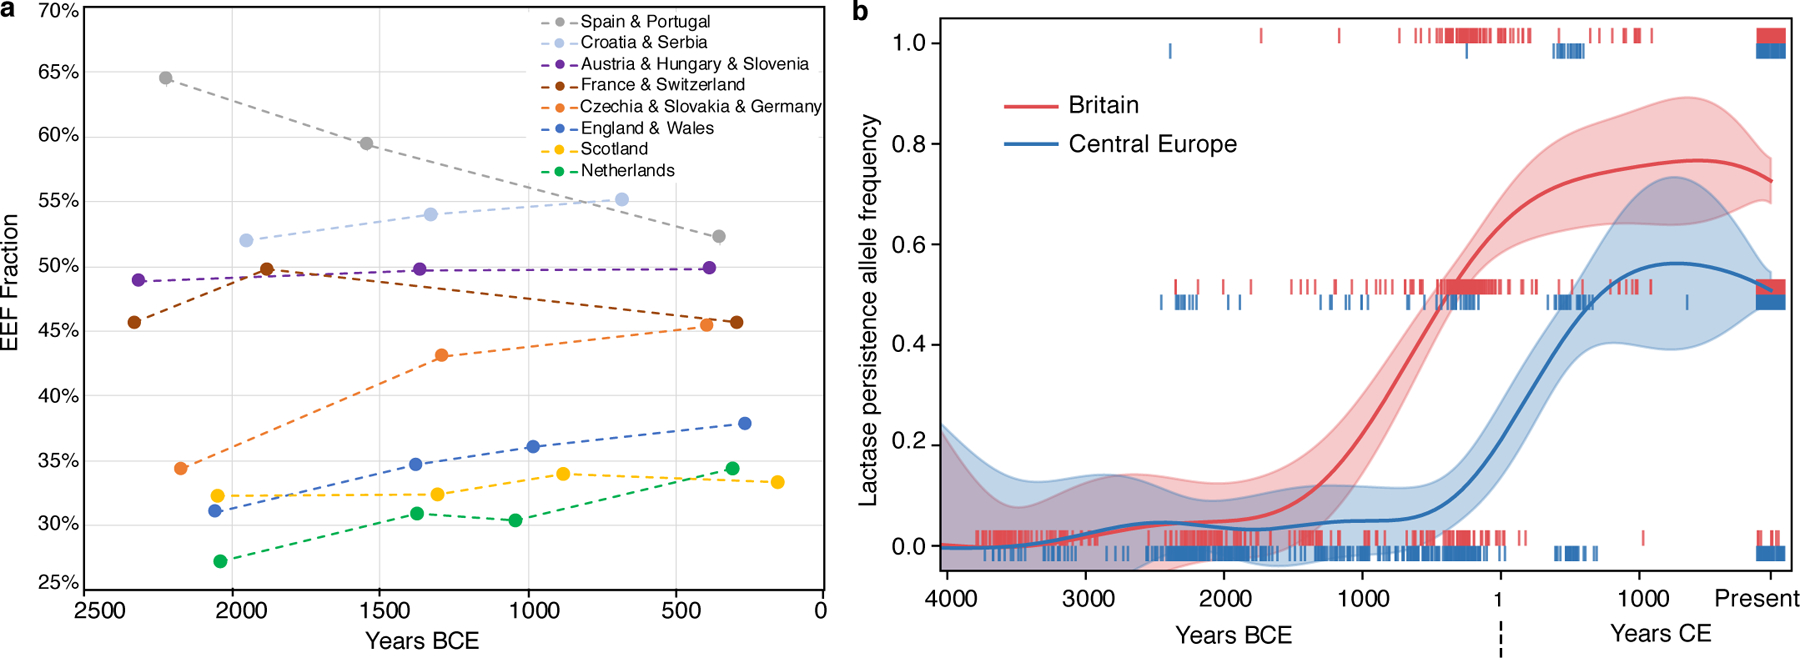
Fig. 4: Genetic change in Britain in the context of Europe-wide trends.

(A) Eight ancient DNA time transects for up to four periods, plotting the mean of the EEF inference on the y-axis and on the x-axis using the average of dates of individuals in periods defined for each region as in Supplementary Table 5. Sample sizes used to compute each point are given in Supplementary Table 7. Dotted lines connecting points should not be interpreted as implying a smooth change over time and instead are meant to help in visual discernment of which groups of points come from the same time transects. (B) The allele conferring lactase persistence experienced its major rise about a frequency millennium earlier in Britain than in Central Europe suggesting different selection regimes and possibly cultural differences in the use of dairy products in the two regions in the IA. This analysis based on imputed data includes 459 ancient individuals from Britain and 468 from Central Europe (Czech Republic, Slovakia, Croatia, Hungary, Austria, Germany and Slovenia) (we then co-analyzed with present-day individuals; Methods). Each vertical bar represents the derived allele frequency for each individual with values [0, 0.5, 1]; we use jitter on the x-axis, and show in shading the inferred 95% confidence interval for the allele frequency at each time point.
