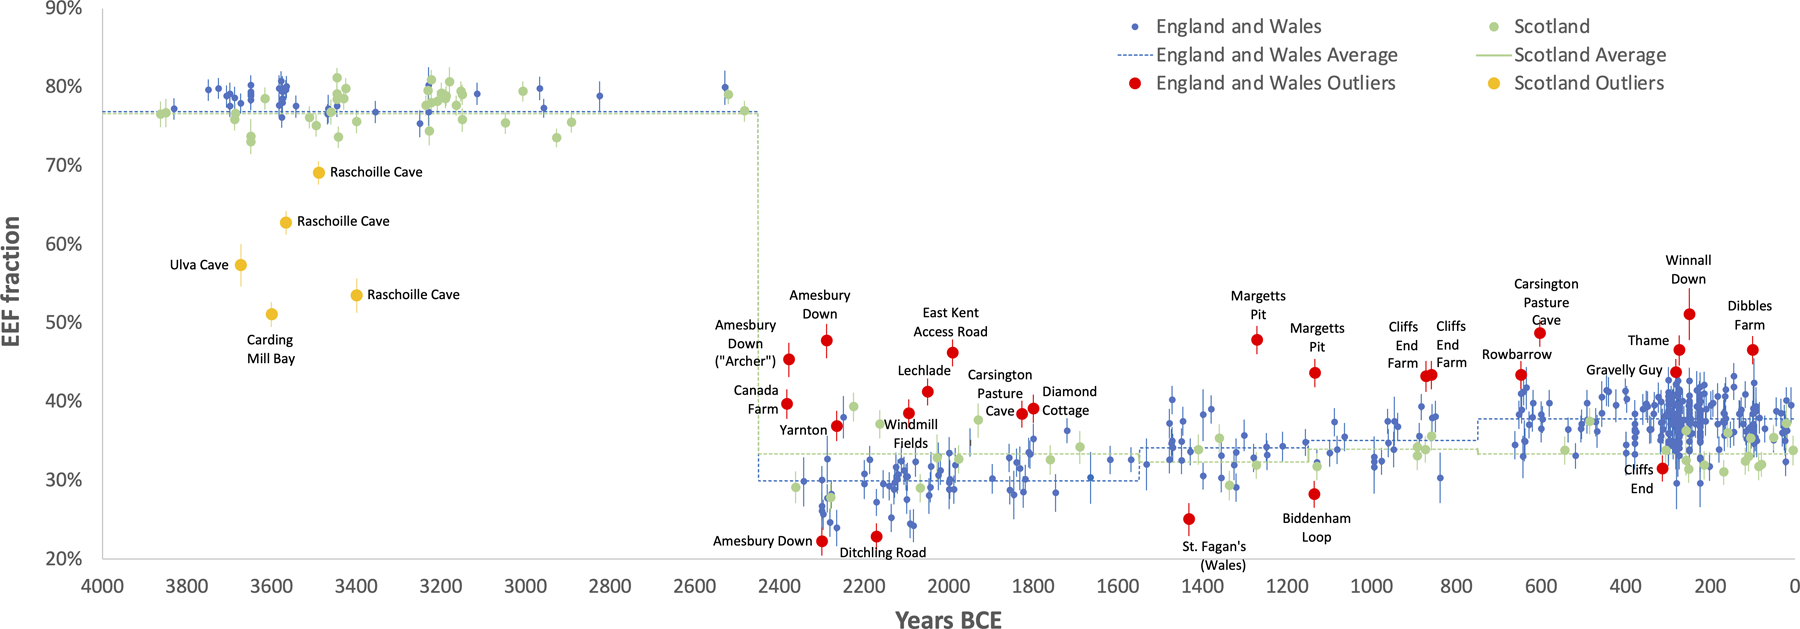
Extended Data Fig. 2 |. By-individual analysis of the British time transect.

Version of Figure 3 with the time transect extended into the Neolithic, and adding in individuals from Scotland. We plot mean estimates of EEF ancestry and one standard error bars from a Block Jackknife for all individuals in the time transect that pass basic quality control, that fit to a three-way admixture model (EEF + WHG + Yamnaya) at p>0.01 using qpAdm, and for the Neolithic period that fit a two-way admixture model (EEF + WHG) at p>0.01. Individuals that fit the main cluster of their time are shown in blue (southern Britain) and green (Scotland), while red and orange respectively show outliers at the ancestry tails (identified either as p<0.005 based on a qpWave test from the main cluster of individuals from their period and |Z|>3 for a difference in their EEF ancestry proportion from the period, or alternatively p<0.1 and |Z|>3.5). The averages for the main clusters in both southern Britain and Scotland in each archaeological period (Neolithic, C/EBA, MBA, LBA and IA) are shown in dashed lines.
